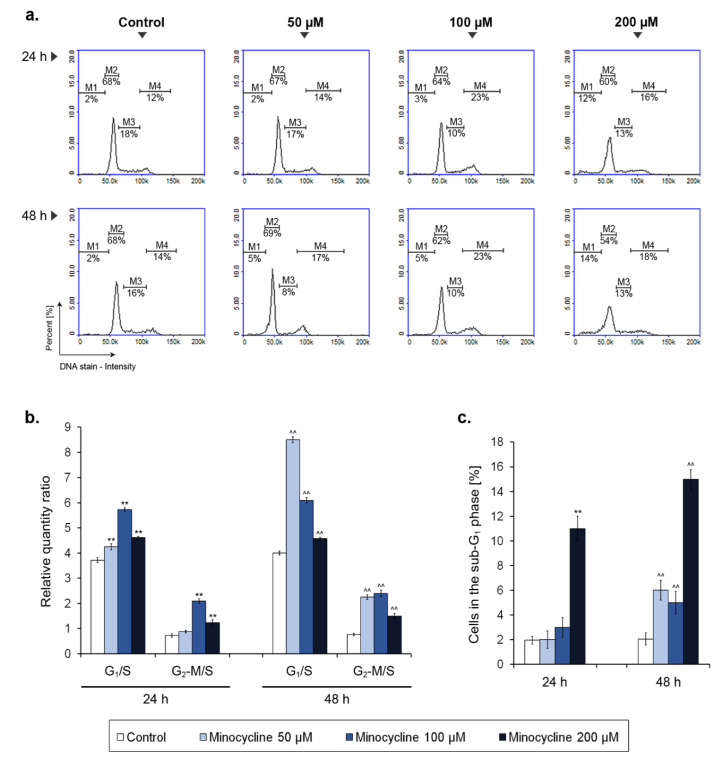
Figure 5.
Minocycline-induced changes of cell cycle in human melanoma cells treated for 24 h and 48 h. Representative histograms for the tested groups show distribution of cells in the individual phases of cell cycle (a). The results of the cell cycle analysis are presented as a relative quantity ratio of G1/S and G2-M/S (b). The number of cells in the sub-G1 phase is shown as the percentage of the tested population (c). ** p < 0.005 vs. control 24 h; ^^ p < 0.005 vs. control 48 h.

