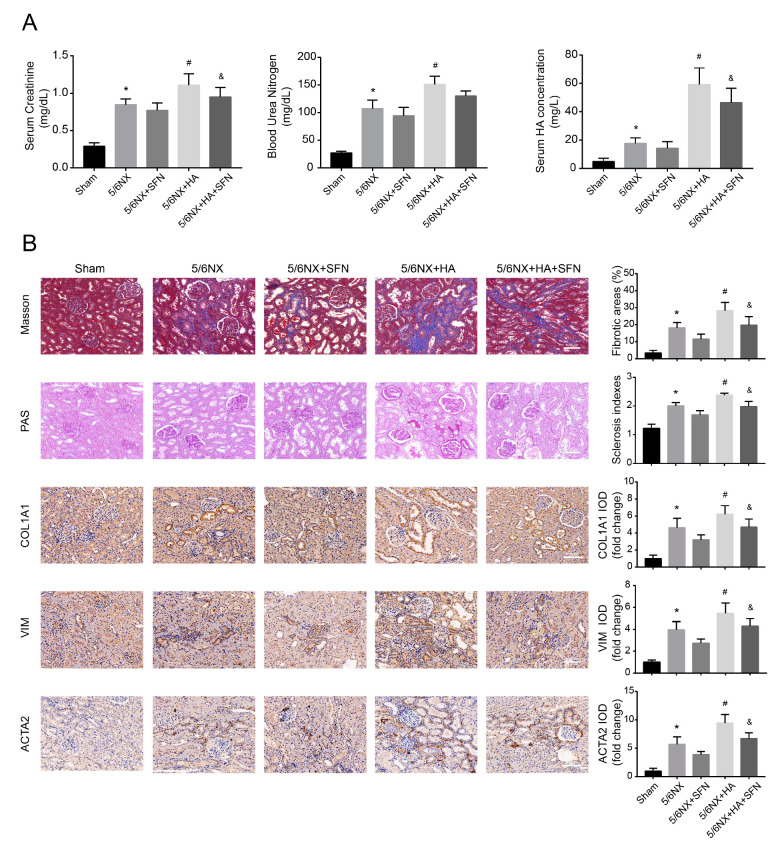
Figure 7.
Effects of HA on dysfunction and fibrosis in rat kidneys. (A) Serum creatinine (SCr), blood urea nitrogen (BUN), and serum HA concentrations in rats. (B) Fibrotic areas, sclerosis indexes, and immunohistochemistry data for collagen-I (COL1A1), vimentin (VIM), and alpha-smooth muscle actin (ACTA2) in kidney samples. Positive areas were quantified (right) by densitometry. Bar = 100 μm. Data are presented as the means ± standard deviation (n = 9 per group). * p < 0.05 vs. sham group; # p < 0.05 vs. 5/6th nephrectomy (5/6NX) group; and & p < 0.05 vs. 5/6NX + HA group.

