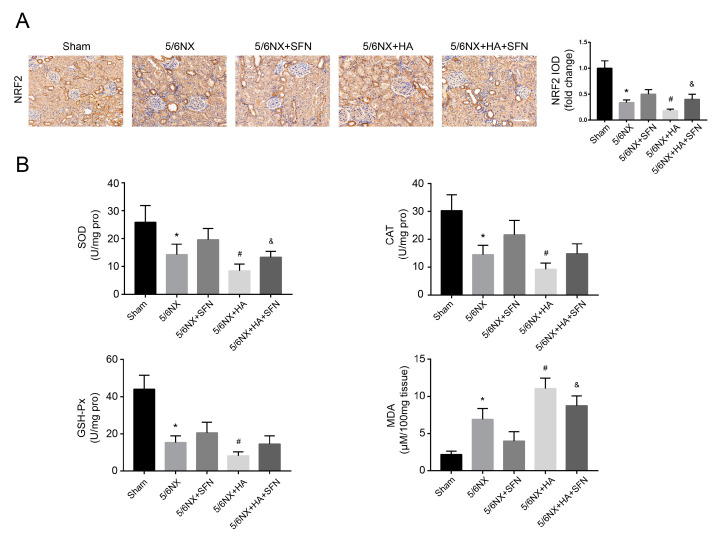
Figure 8.
Effects of HA on redox imbalance in rat kidneys. (A) Immunohistochemistry for NRF2. Positive areas were quantified (right) by densitometry. Bar = 100 μm. (B) Levels of superoxide dismutase (SOD), catalase (CAT), glutathione peroxidase (GSH-Px), and malondialdehyde (MDA). Data are presented as the mean ± standard deviation (n = 9 per group). * p < 0.05 vs. sham group; # p < 0.05 vs. 5/6th nephrectomy (5/6NX) group; and & p < 0.05 vs. 5/6NX + HA group.

