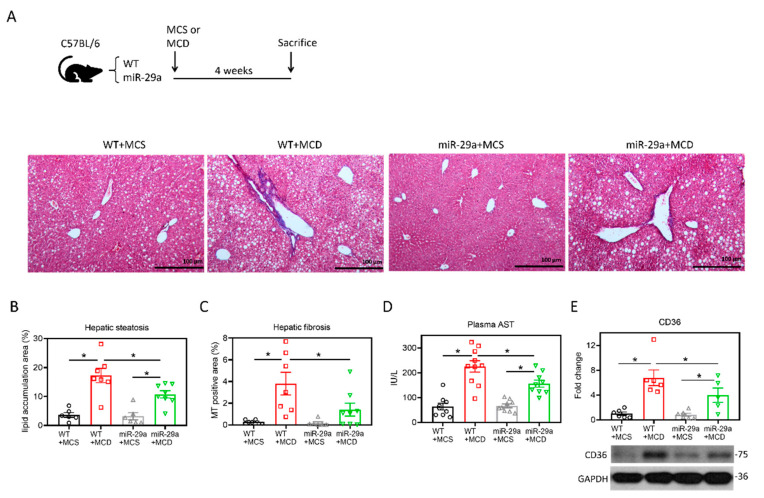
Figure 1.
Overexpression of miR-29a attenuates MCD-induced hepatic steatosis and fibrosis. (A) Representative images of Masson’s trichrome stain. Vacuole formation and blue stain indicate hepatic lipid accumulation and collagen matrix accumulation, respectively. (B,C) Quantification of vacuole formation (hepatic steatosis) and blue stain (hepatic fibrosis). (D) Plasma aspartate aminotransferase (AST) level was determined with SPOTCHEM EZ automated biochemical analyzer. (E) Representative immunoblot result and densitometric quantification of CD36 protein expression. Data from five to ten samples per group are expressed as mean ± SE. *p < 0.05 between indicated groups. MCD, methionine/choline-deficient; MCS, methionine/choline-sufficient.

