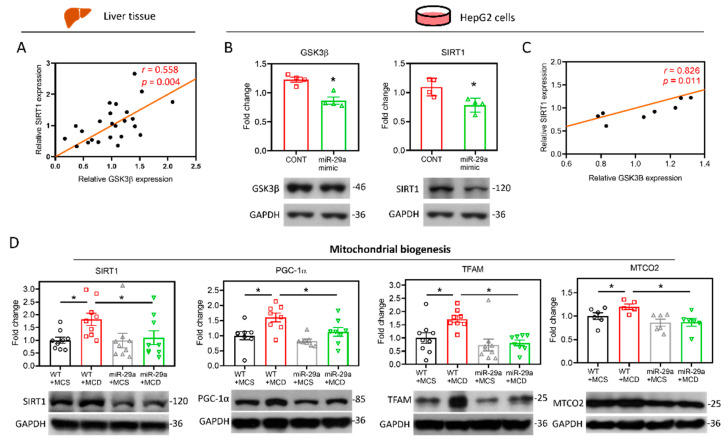
Figure 6.
miR-29a/GSK3β axis counterbalances the perturbation of SIRT1-mediated mitochondrial biogenesis. (A) Pearson’s correlation of GSK3β with SIRT1 in the mouse liver (N = 24). (B) Human HepG2 cells were transfected with miR negative control (CONT) or miR-29a mimic for 24h. The protein expression level of GSK3β and SIRT1 was determined by Western blot. GAPDH level as loading control (N = 4). (C) Pearson’s correlation of GSK3β with SIRT1 in the HepG2 cells (N = 8). *p < 0.05 compared with CONT group. (D) Representative blots and densitometric results of SIRT1, PGC-1α, TFAM and MTCO2, which represent indicators of mitochondrial biogenesis. N = 6–9 in each group.

