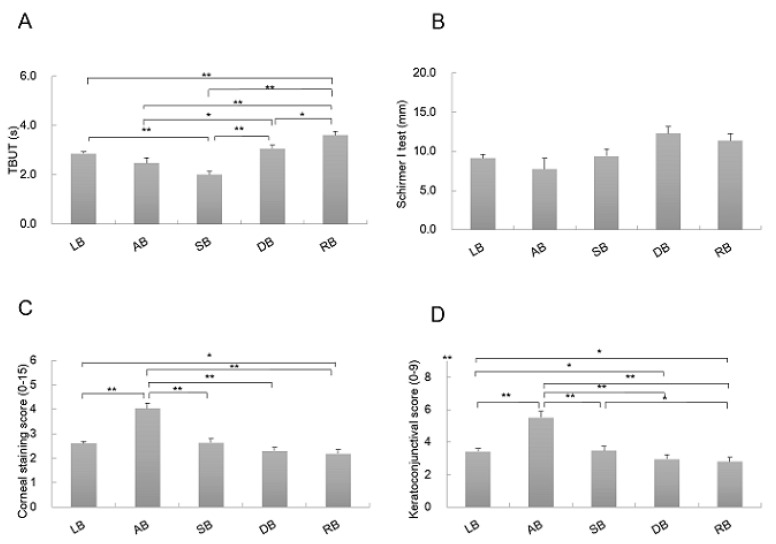
Figure 2.
Results of fluorescein breakup patterns of tear examination and ocular surface results. Each graph shows the results of FBUPs of (A) FBUT, (B) Schirmer I test, (C) cornea staining score (National Eye Institute grading system scoring system), and (D) keratoconjunctival staining score (van Bijsterveld staining system). AB = area break; DB = dimple break; FBUPs = fluorescein breakup patterns; LB = line break; RB = random break; SB = spot break; FBUT = fluorescein breakup time. Data are estimate ± standard error. * p < 0.05, ** p < 0.01 between two comparisons.

