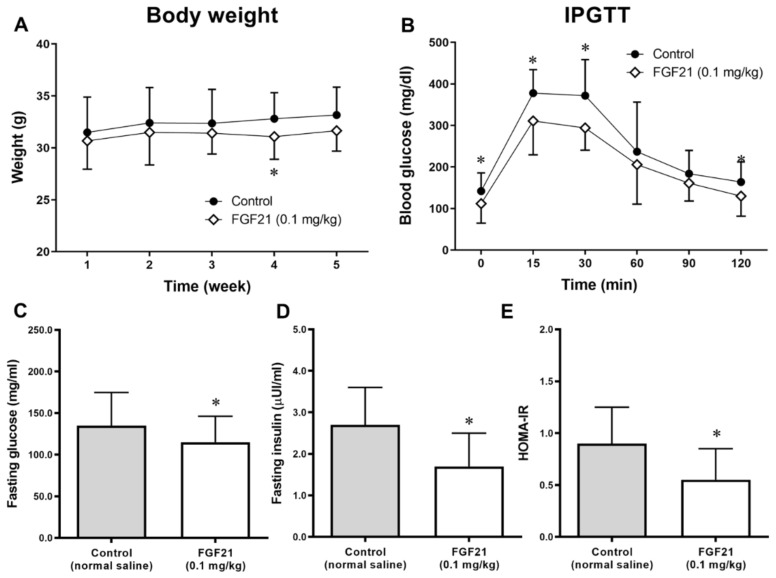
Figure 1.
(A) Weight changes during the 5 weeks of treatment. (B) Glucose levels measured at 0–120 min during the intraperitoneal glucose tolerance test (IPGTT) at the end of study. (C–E) Fasting glucose and insulin concentrations after 5 weeks of treatment with normal saline or the fibroblast growth factor 21 (FGF21) analogue LY2405319. (E) Homeostasis model assessment of insulin resistance (HOMA-IR) calculated from fasting glucose and insulin levels. Data are means ± standard deviation (SD). * p < 0.05 vs. control.

