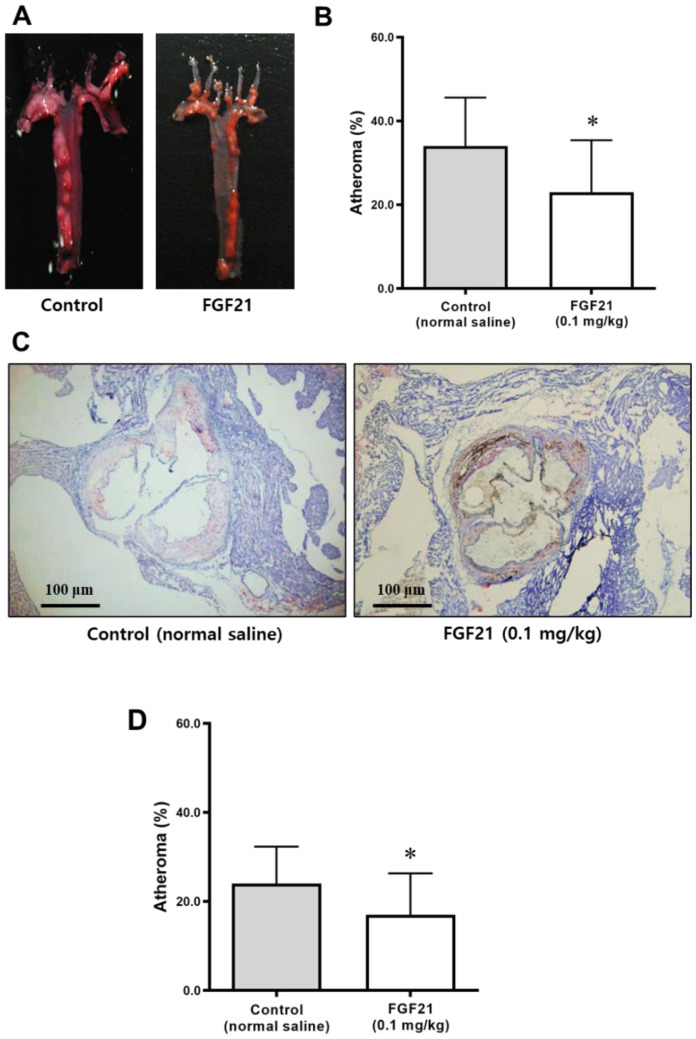
Figure 4.
Atheroma burden in the aorta of ApoE−/− mice after 5 weeks of treatment with FGF21 or normal saline. (A,C) Representative images of atheroma stained using Oil Red O of the aortic arch (A) and aortic valve areas (scale bars, 100 μm) (C) from ApoE−/− mice. The red color indicates plaque accumulation. (B,D) The atheromatous plaque area (% of total area) was smaller in the aortic arch (B) and aortic valve (D) of the FGF21-treated mice compared with the control. Data are means ± SD. Weight-adjusted comparison was used. * p < 0.05 vs. control.

