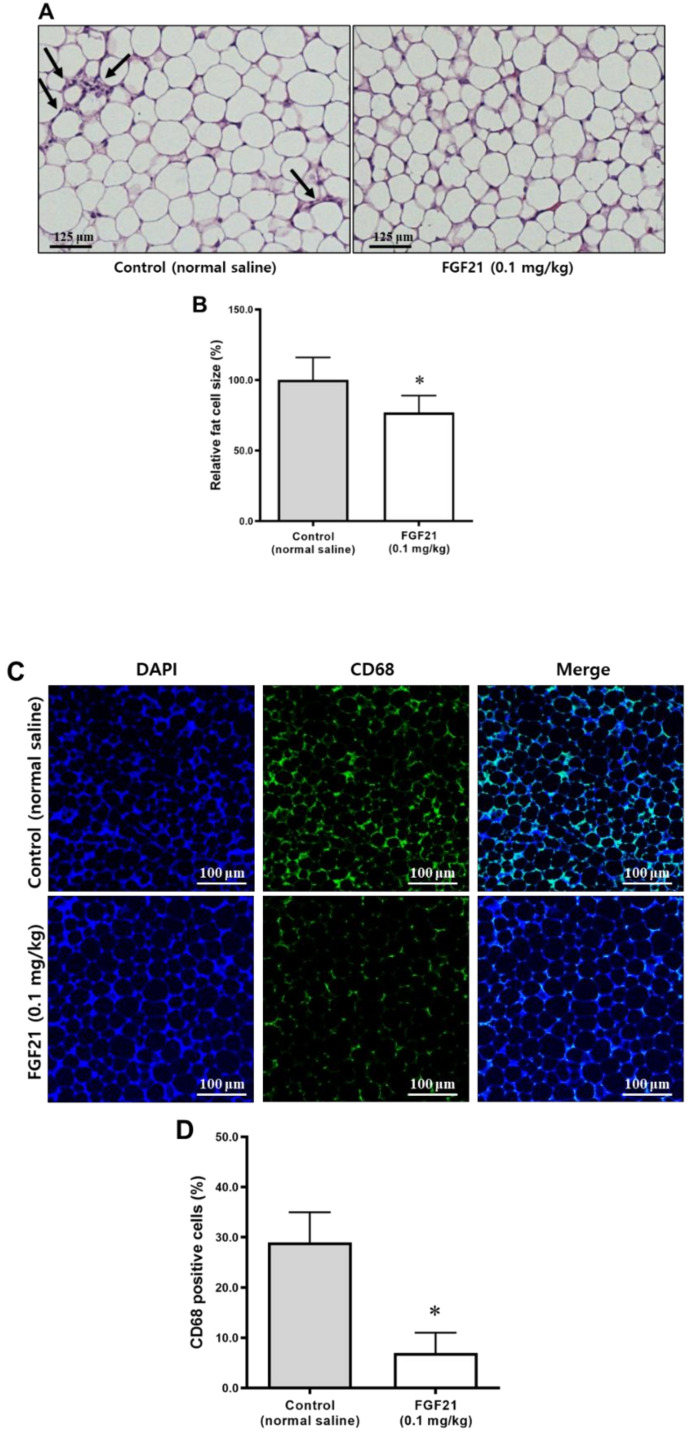
Figure 5.
(A) Histology of abdominal visceral adipose tissues stained with H&E (scale bars, 20 μm). The arrows indicate crown-like structures. (B) Comparison of fat cell size (% of control) between the control and the FGF21 groups. (C) Immunohistochemical staining of CD68 in the abdominal visceral adipose tissue (scale bars, 20 μm). (D) CD68-positive cells were significantly less abundant in the FGF21-treated mice than in the controls (% of total cells). Data are means ± SD. * p < 0.05 vs. control.

