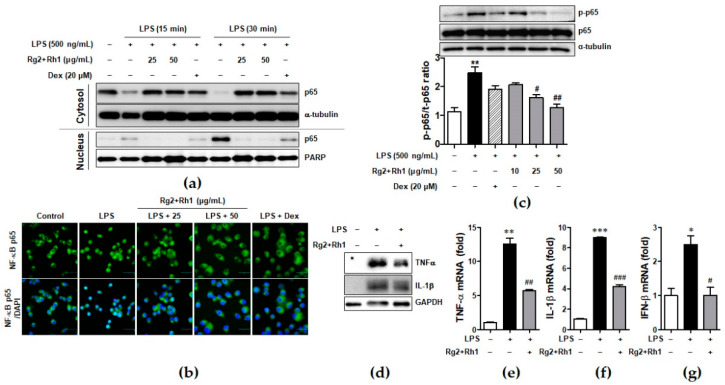
Figure 4.
Effect of ginsenosides Rg2 and Rh1 on NF-κB p65 nuclear translocation and activation and cytokine production. (a) The RAW264.7 cells were pre-treated with the combination of ginsenosides Rg2 and Rh1 (1:1 ratio) at different concentrations (25 and 50 μg/mL) for 24 h followed by treatment with LPS (100 ng/mL) for 15 or 30 min. Cytosolic and nuclear proteins were extracted and subjected to western blotting. (b) The RAW264.7 cells were pre-treated with the combination of ginsenosides Rg2 and Rh1 (1:1 ratio) at different concentrations (25 and 50 μg/mL) for 24 h followed by treatment with LPS (100 ng/mL) for 15 min. Immunofluorescence analysis was performed after fixing and immunostaining with NF-κB p65. DAPI was co-stained for visualizing nucleus. Images are shown at ×600 magnification. Scale bar indicates 30 μm. (c) The RAW264.7 cells were pre-treated with the combination of ginsenosides Rg2 and Rh1 (1:1 ratio) at various concentrations (10, 25, and 50 μg/mL) for 1 h followed by treatment with LPS (500 ng/mL) for 3 h. Whole protein lysates were subjected to western blotting. (Lower bar graph) The ratio of phosphorylated p65/α-tubulin expression represents as the mean ± SEM (n = 8). (d–g) Peritoneal macrophages were collected from the mice that were i.p. injected with the combination of ginsenosides Rg2 and Rh1 (1:1 ratio, 20 mg/kg) for 24 h followed by treatment with LPS (10 mg/kg) for 24 h. Inhibitory effects of the ginsenosides on protein expressions of TNF-α and IL-1β were analyzed by western blotting (d), and mRNA levels of TNF-α (e), IL-1β (f), and IFN-β (g) were analyzed by qRT-PCR. Each cytokine was normalized by glyceraldehyde 3-phosphate dehydrogenase (GAPDH) (n = 3). Data was calculated using the 2−ΔΔCt method and represented as mean ± SEM (n = 3). * p < 0.05, ** p < 0.01, and *** p < 0.001 compared with control sample, # p< 0.05, ## p < 0.01, and ### p < 0.001 compared with LPS-treated sample.

