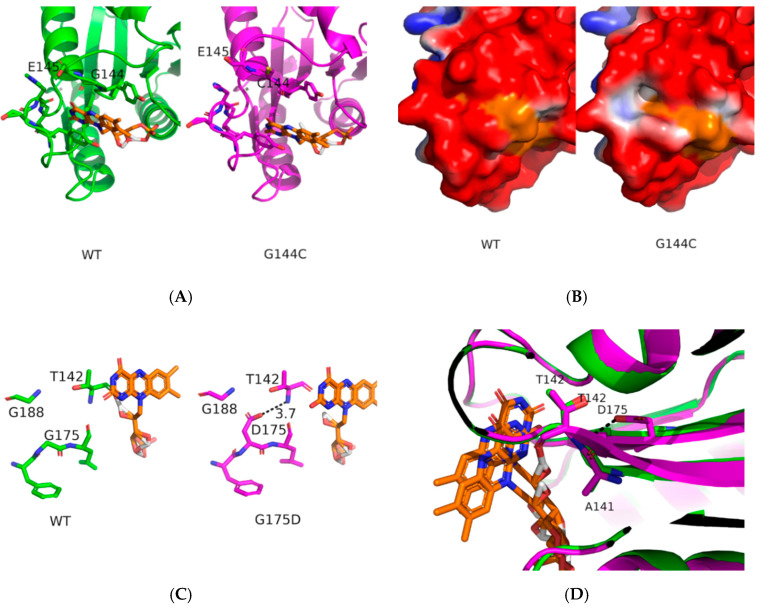
Figure 5.
Effects of the G144C and G175D mutations. Panel (A) presents the wild-type (green, simulation 1) and G144C (magenta, simulation 1) average structures. Panel (B) presents a mapping of the electrostatic potential onto the solvent excluded surface of wild-type (left) or G144C mutant (right), the orange color corresponds to the surface of the flavin mononucleotide (FMN) residue. Panel (C,D) presents detailed view of the wild-type (green, simulation 1) and G175D (magenta, simulation 1) average structures.

