Figure 1.
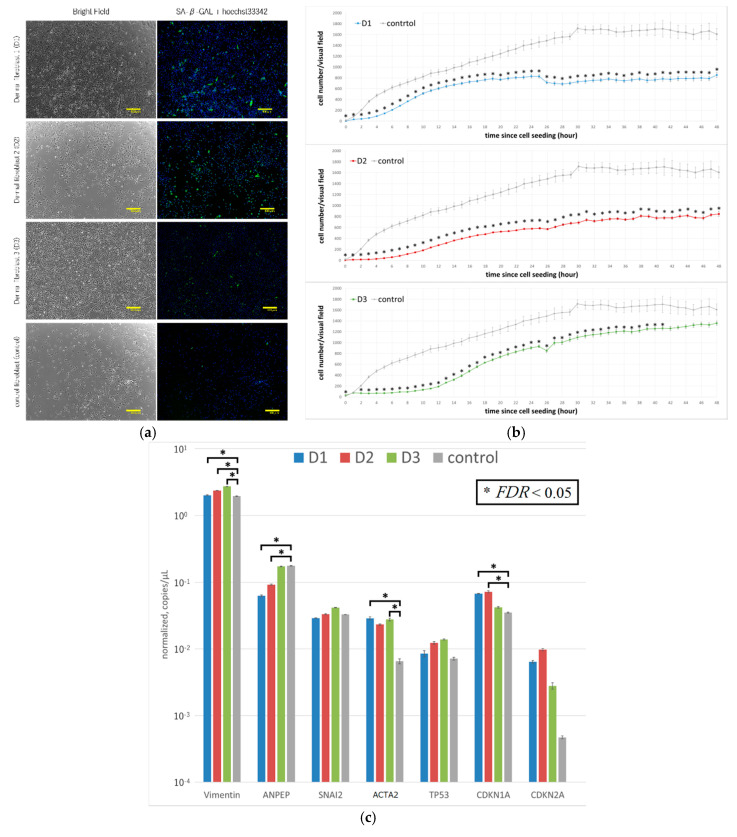
Fibroblasts from the dermal tissue of three elderly patients. (a) Left: bright field images of primary cultured dermal fibroblasts derived from three patients. From top to bottom, the cells shown are D1, D2, D3, and control fibroblasts. Right: images of the same cells, immunofluorescently stained for SA-β-Gal and stained with hoechst33342. Scale bars: 400 µm. (b) Cell proliferation of fibroblasts from the same three elderly patients. From top to bottom, the graphs show: D1 vs. control, D2 vs. control, and D3 vs. control. The cell number of six points per well was measured at 1-h intervals. The number of cells in the images obtained at 48 h after cells were seeded into a dish was calculated using the Keyence BZ-X710 microscope macro cell count mode. Mean values were plotted on a graph. Results are shown as the mean + SEM (* p < 0.05, n = 6). (c) Expression levels of vimentin, ANPEP, SNAI2, ACTA2, TP53, CDKN1A, and CDKN2A in fibroblasts from the same three elderly patients and in control fibroblasts. Values shown are the mean ± SEM (* FDR < 0.05, by two-way ANOVA).

