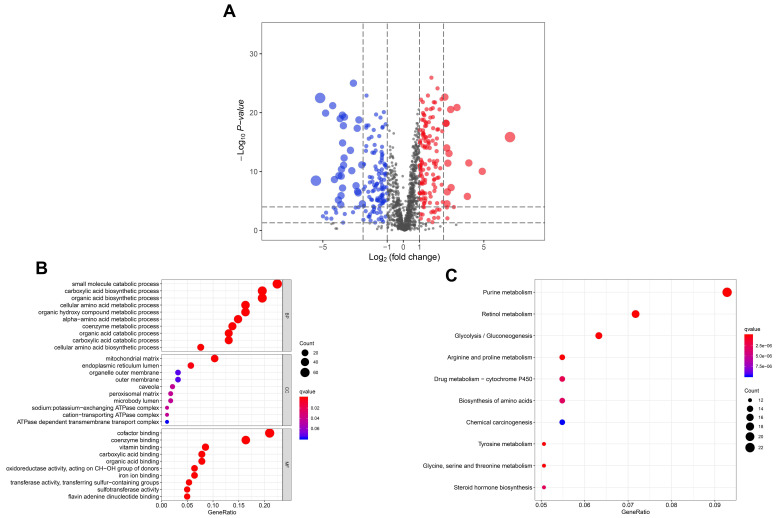
Figure 1.
The significantly altered metabolic enzymes in The Cancer Genome Atlas (TCGA) head and neck squamous cell carcinoma (HNSCC) cohort. (A) Volcano plot of metabolic enzymes between HNSCC tissues and normal tissues. Y-axis indicates the p values (log10-scaled), whereas the X-axis indicates the fold change (log2-scaled). Each symbol represents a different metabolic enzyme. The red and blue color indicates the significantly upregulated and downregulated metabolic enzymes, respectively. (B,C) Gene Ontology (GO) and Kyoto Encyclopedia of Genes and Genomes (KEGG) analysis of the significantly altered metabolic enzymes.

