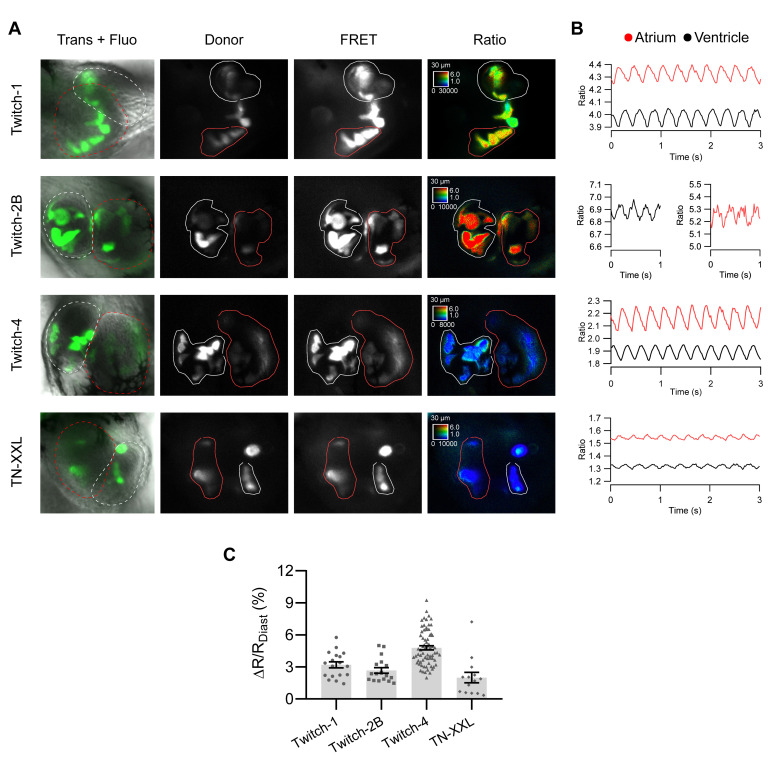
Figure 2.
Ratiometric imaging of zebrafish heart Ca2+ dynamics with TnC-based biosensors. (A) Images of 3 dpf embryos transiently expressing the indicated biosensors at various levels in different cells owing to mosaicism. The overlay of transmission and fluorescence images show the location of the atrium and the ventricle. Donor and FRET channel images correspond to the emission of the donor and acceptor FP, both excited at 440 nm. The ROIs outlined in red and white were used to quantify changes in the atrium and ventricle, respectively. The emission ratio image (FRET image/donor image) is shown in pseudo color with the same scaling applied to all biosensors to facilitate their comparison. The calibration squares show the distance in µm, whereas the hue codes for the emission ratio and intensity codes for the fluorescence intensity. Embryos were treated with PAB to decrease the heart motion. (B) The traces of the emission ratio over time (acquired at 50 images/s) of the embryos displayed in (A) is shown (unprocessed data). The ratios were seen to oscillate in synchrony with heart contractions in the atrium (red) and ventricle (black). (C) Percentage of ratio change between systole and diastole (%(ΔR/Rdiastole)) obtained with each biosensor. The bars show the mean ± S.E.M, and each dot is one embryo, n = 14 to 70 embryos of one or four independent experiments.

