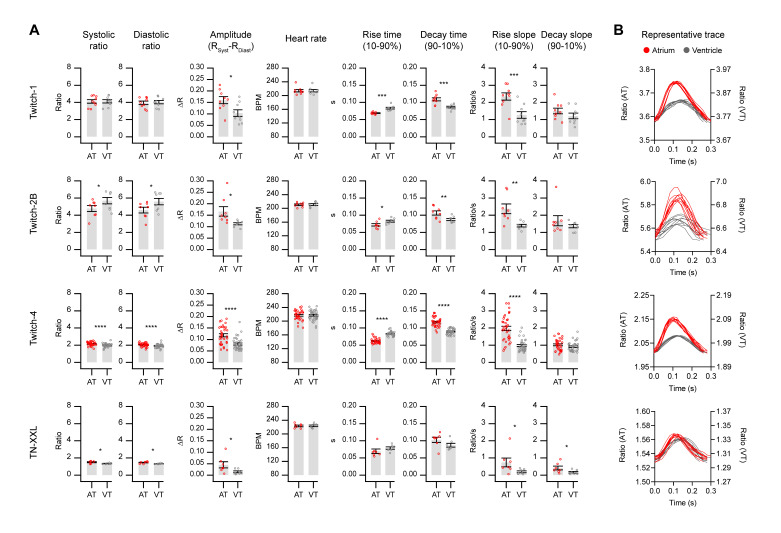
Figure 4.
Basal cardiac Ca2+ kinetics obtained with each biosensor. (A) Several kinetic parameters of Ca2+ changes in the atrium (red) and the ventricle (gray) in 3 dpf zebrafish embryos were extracted with custom routines written in Igor Pro 8 software (see Methods and Figure 1 for definition of each parameter). The bars show the mean ± S.E.M and each dot represents one embryo, n = 7 to 35 embryos of one or four independent experiments. A paired Student’s t-test was used (* p < 0.05, ** p < 0.01, *** p < 0.001, **** p < 0.0001). (B) The shape of the Ca2+ transients in the atrium (red) and the ventricle (gray) during contractions of a representative embryo for each GECI is shown. The traces were aligned at the start of each peak in both the atrium and ventricle, thus the delay in ventricular versus atrial Ca2+ rise is not shown. Note the different ratio scales for the atrium (AT) and ventricle (VT).

