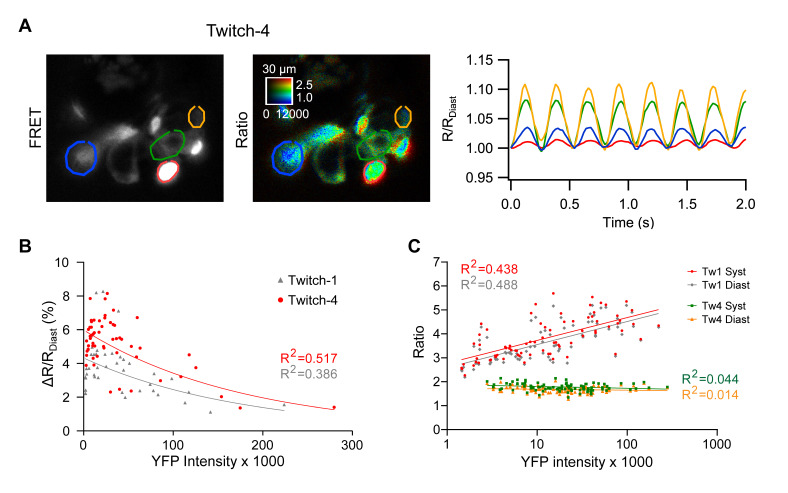
Figure 5.
Effect of the expression level of the biosensors on the emission ratio and on the systolic ratio change (ΔR). (A) A representative experiment with variable expression of Twitch-4 between cells in the ventricle is shown (left, fluorescence intensity image of the FRET channel; right, ratio image in pseudo color). Regions-of-interest (ROI) were manually drawn on cells expressing increasing levels of biosensor (from yellow to green, blue and red). The color-coded traces in the graph correspond to the cells in the images. (B) Dependence of the relative ratio change (%[ΔR/Rdiastole]) on the expression level of Twitch-1 and Twitch-4 in the ventricle, estimated as the fluorescence intensity of directly excited YFP. Each dot represents one cell in 11 to 13 embryos of three independent experiments. Data were adjusted to an exponential model (for Twitch-1: r = −0.621, R2 = 0.386, p < 0.0001, n = 41; for Twitch-4: r = −0.719, R2 = 0.517, p < 0.0001, n = 56). (C) Effect of biosensor concentration (estimated by YFP fluorescence) on the emission ratio of Twitch-1 and Twitch-4, in systole and diastole (logarithmic scale). Data of Twitch-1 were adjusted to a logarithmic model (for Rsystole: r = 0.662, R2 = 0.438, p < 0.0001, n = 77; for Rdiastole: r = 0.699, R2 = 0.488, p < 0.0001, n = 77); the Twitch-4 ratio data did not correlate with YFP intensity.

