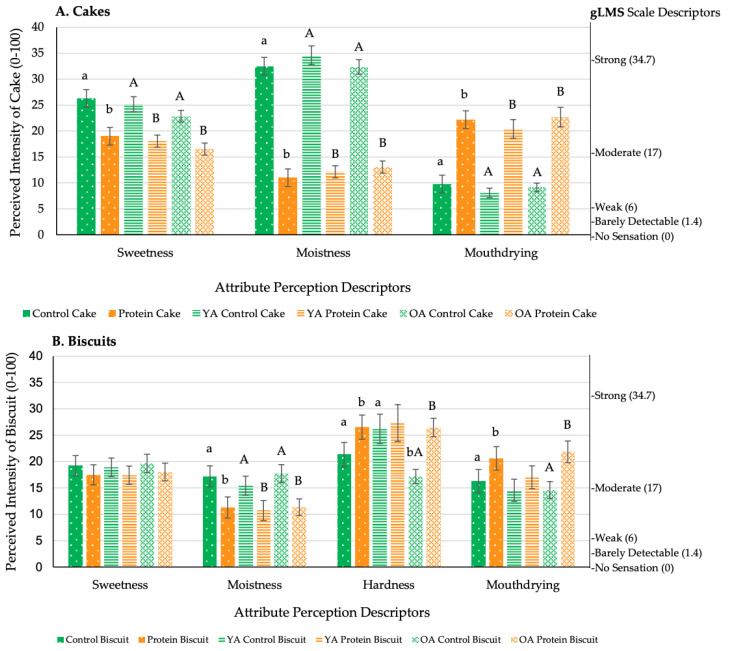
Figure 5.
Volunteers attribute perception mean ratings of (A) cakes and (B) biscuits by overall and age (pilot study: n = 84; generalised Labelled Magnitude Scale (gLMS) anti-logged data, scale 0–100 summarised on the right of the figure). Values are expressed as LSM estimates ± standard error from SAS output. Significant differences (p < 0.05) between samples (by overall: control vs. protein, and age: younger adults (YA) vs. older adults (OA)) are denoted by differing small letters, and significant differences within age groups are denoted by differing capital letters; no letter reflects no significant difference.

