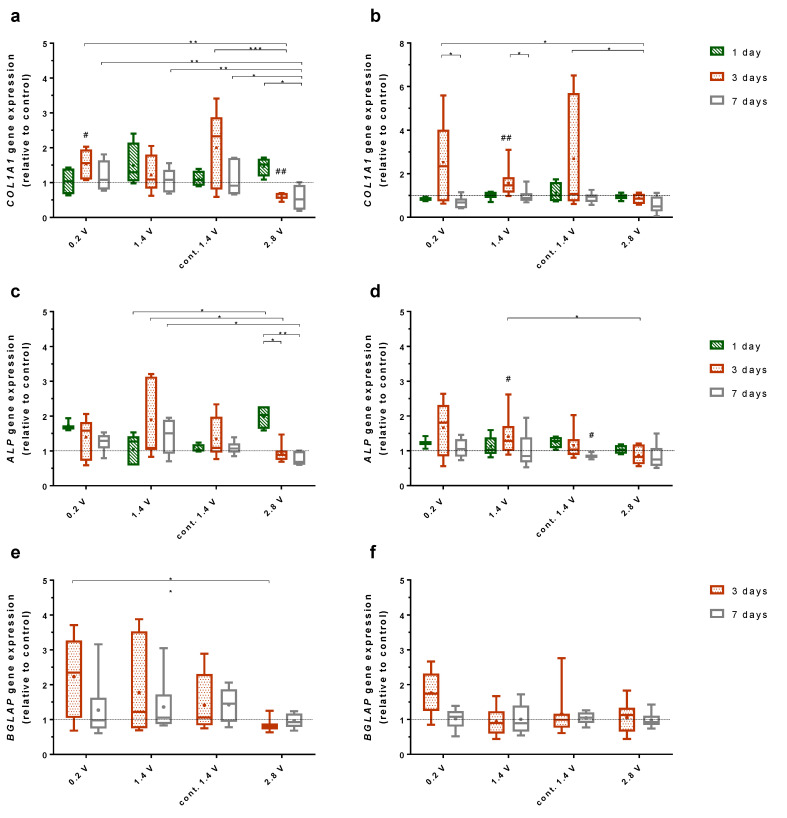
Figure 3.
2−ΔΔCt values for the gene expression of collagen type I (COL1A1; a,b), alkaline phosphatase (ALP; c,d), and osteocalcin (BGLAP; e,f) after electrical stimulation, compared to the unstimulated controls for the same time points. Cells were cultured on Ti6Al4V electrodes (a,c,d) and collagen-coated coverslips (b,d,f) for one, three, and seven days. The 0.2V, 1.4 V, and 2.8 V groups were stimulated 3 × 45 min per day, while the cont. 1.4 V group was stimulated continuously with 1.4 V. # indicates significant differences between the stimulated and control groups: # p < 0.05 and ## p < 0.01 (Wilcoxon matched pair test), * indicates significant differences between stimulation groups: * p <0.05, ** p < 0.01, *** p < 0.001 (two-way ANOVA). n ≥ 3.

