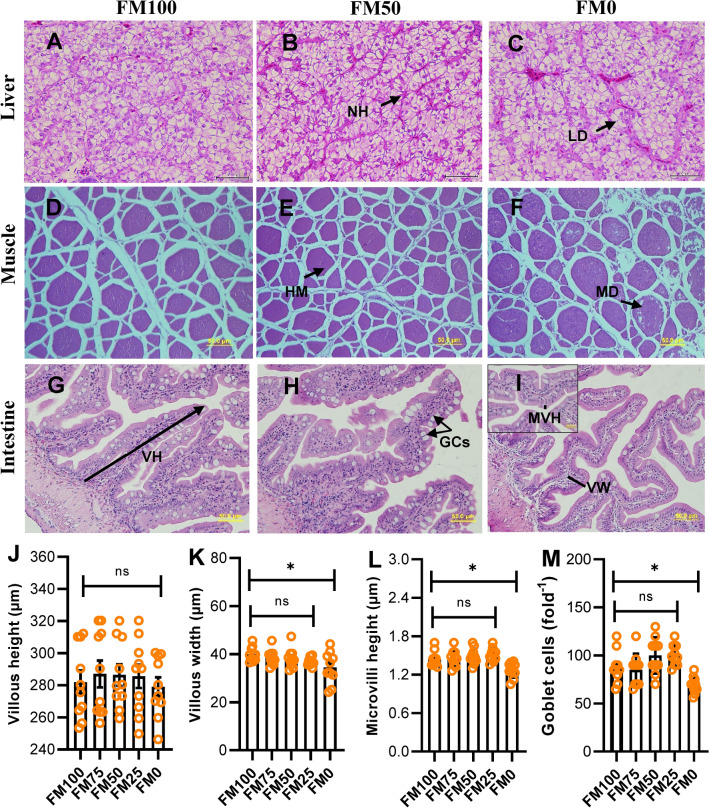
Figure 2.
Representative micrographs of liver (A–C), muscle (D–F) and intestine (G–I) of juvenile barramundi after 7 weeks of experimental trials. All sections are stained with H&E with 40 magnification. Variation in villous height (J), villous width (K), microvilli height (L) and goblet cells density (M) in fish fed test diets, compared by Turkey multiple comparison test at P < 0.05. NH, normal hepatocyte; LD, lipid droplet; HM, healthy myotome; DM, myodigeneration; VH, villous height; GCs, goblet cells; VW, villous width and MVH, microvilli height.

