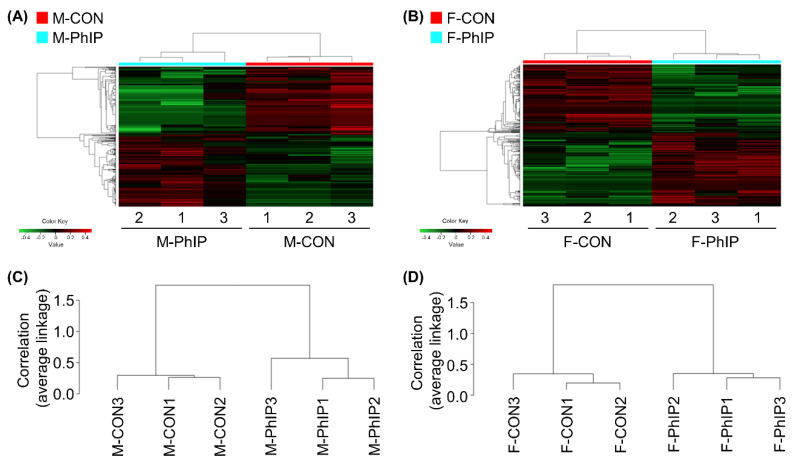
Figure 1.
Hierarchical clustering and heatmap for differentially expressed genes (DEGs) of colon transcriptome profiles. (A,B) Heatmap and hierarchical clustering of log2 fold changes indicate DEGs (rows) between control and 2-amino-1-methyl-6-phenylimidazo[4,5-b]pyridine (PhIP) groups in (A) male and (B) female. Red keys indicate an increased gene expression in PhIP-treated group compared to the control, whereas green keys indicate down-regulation. (C,D) Dendrogram of hierarchical clustering, performed with the Pearson’s correlation coefficient and the average linkage method, which shows the interclass correlation between control and PhIP groups in (C) male and (D) female. M-PhIP, male mice treated with PhIP; M-CON, control male mice; F-PhIP, female mice treated with PhIP; F-CON, control female mice.

