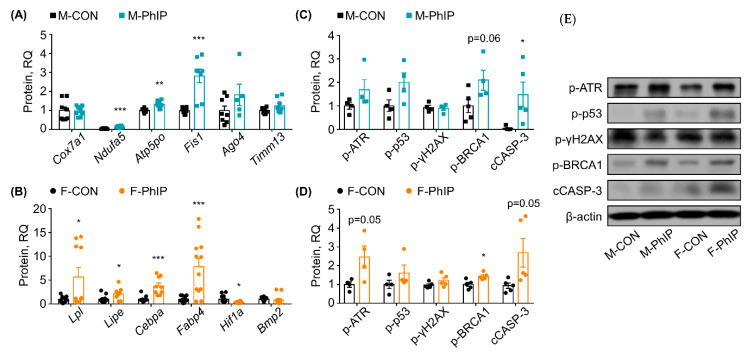
Figure 3.
Validation of transcriptomics results using quantitative polymerase chain reaction (qPCR) analysis and assessment of protein expressions involved in DNA damage response (DDR) and apoptosis markers. (A) Genes were randomly selected from the top canonical pathways (i.e., Oxidative Phosphorylation, Mitochondria Dysfunction, eIF2 Signaling and Sirtuin Signaling Pathway) of the male colon transcriptome and assessed using qPCR analysis. (B) Genes were randomly selected from the top canonical pathways (i.e., Triacylglycerol Degradation, Retinol Biosynthesis and Adipogenesis Pathway) of the female colon transcriptome and assessed using qPCR analysis. Values are means ± SEM (n = 5, n for repeated measures = 7–8). (C,D) Key proteins responsible for the DDR signaling pathway and apoptosis markers were measured using (E) Western blot analysis. Representative protein bands for DDR signaling pathway and apoptosis marker proteins were quantified. Values are means ± SEM (n = 4–5). * p < 0.05, ** p < 0.01, *** p < 0.001 (examined by a two-tailed, Welch’s t-test using GraphPad Prism 3.0 software; GraphPad, San Diego, CA, USA). M-PhIP, male mice treated with PhIP; M-CON, control male mice; F-PhIP, female mice treated with PhIP; F-CON, control female mice.

