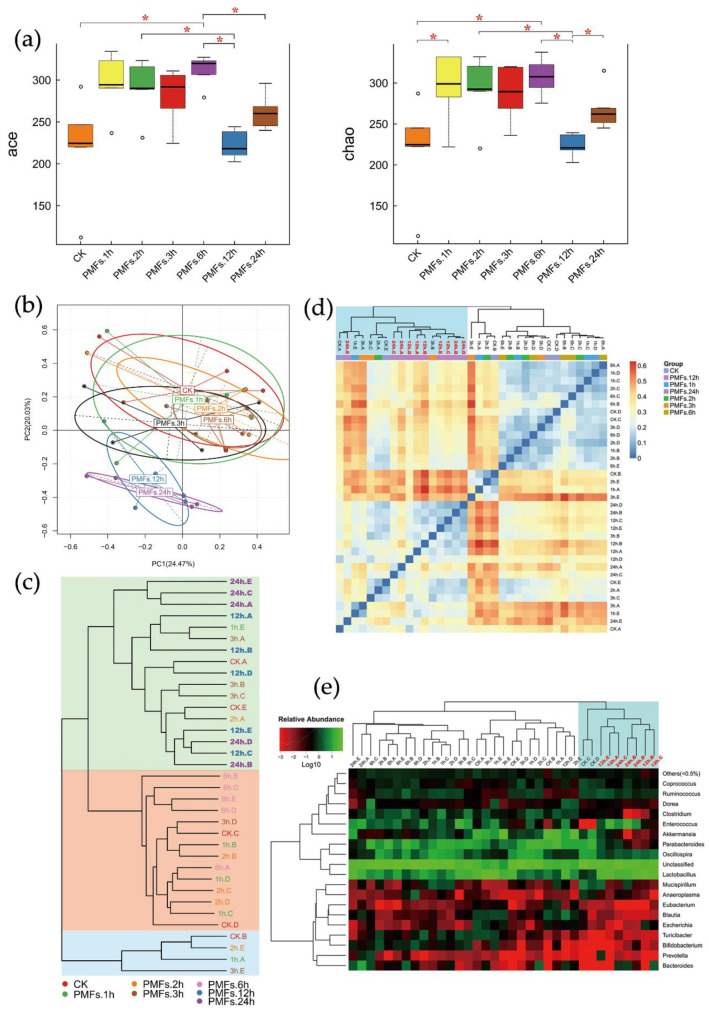
Figure 2.
Administration of PMF-rich fraction significantly altered the composition of mice gut microbiota. (a) Alpha diversity indices boxplot among groups. Five lines from bottom to top is the minimum value, the first quartile, median, the third quartile, and the maximum value, and the abnormal values are outliers shown as “o”; * p < 0.05. (b) Principal component analysis (PCA) based on operational taxonomic unit (OTU) abundance. x-axis, first principal component, and y-axis, second principal component. Numbers in brackets represent contributions of principal components to differences among samples. A dot represents each sample, and different colors represent different groups. (c) Samples clustering (weighted unifrac). The word with the same color represents the samples in the same group, the shorter distance between samples represents high similarity. Samples in the same background color represent a high similarity. (d) Beta diversity heat map (weighted unifrac). Weighted unifrac value was used to measure beta diversity. Groups PMFs.12h and PMFs.24 h were clustered into the same group highlighted in blue in the top-left corner. (e) Log-scaled percentage heat map based on the relative abundance of each species in each sample (genus level). Longitudinal clustering indicates the similarity of all species among different samples, and the horizontal clustering indicates the similarity of certain species among different samples. The closer the distance, the shorter the branch length, and the more similar the species composition between the samples. Relative abundance values were all log-transformed. Most of the samples of groups PMFs.12h and PMFs.24h were clustered into the same group, highlighted in blue in the top-right corner.

