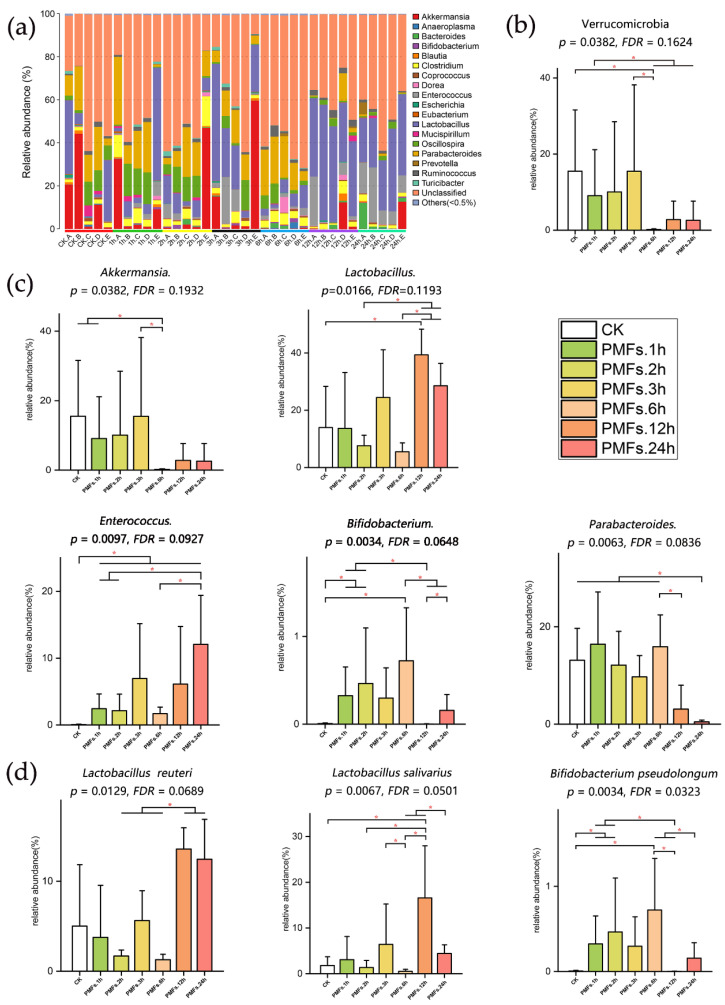
Figure 3.
Specific effect of PMF-rich fraction on the composition and abundance of microbial communities. (a) The taxonomic composition distribution (genus level). “Others (<0.5%)” includes all the taxonomic groups with relative abundance less than 0.5%. (b) Effects of PMF-rich fraction on the composition of gut microbiota at the phylum level. (c) Effects of PMF-rich fraction on the composition of gut microbiota at the genus level. (d) Effects of PMF-rich fraction on the composition of gut microbiota at the species level. Data were expressed as mean ± SD. Kruskal–Wallis test was used for multi-group comparations, wherein the significance level was 0.05 and the p-value was adjusted in the false discovery rate (FDR) method. Wilcoxon rank-sum test was used for two group comparations. * p < 0.05, n = 5 individuals per group.

