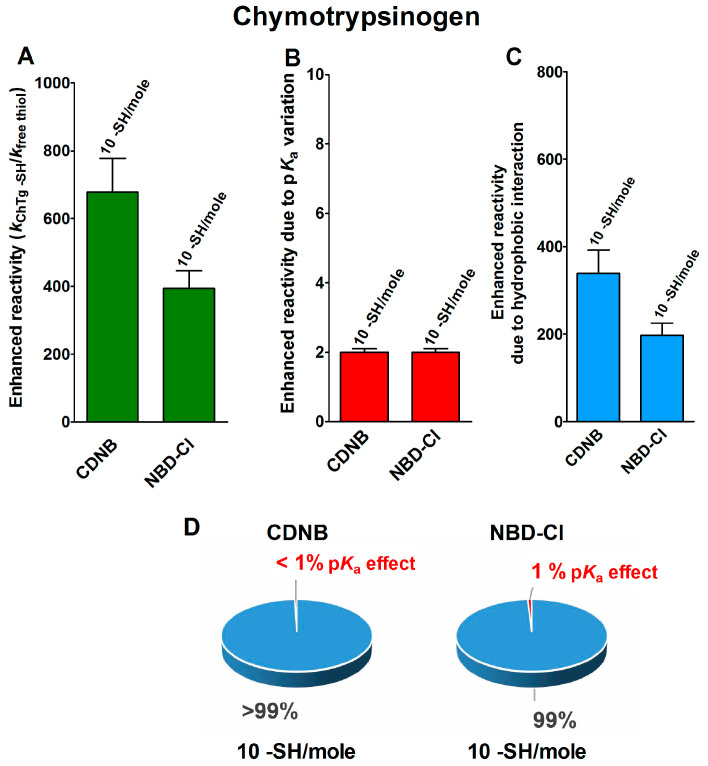
Figure 3.
pKa and hydrophobic effects on the observed hyper-reactivity in the reduced chymotrypsinogen. (A) Experimental kinetic data for the reaction of rChTg with CDNB and NBD-Cl at pH = 5.0, normalized to those of an unperturbed protein cysteine (enhanced reactivity) [16]. (B) Enhanced reactivity due to the experimental lower pKa for 10 cysteines (pKa = 8.1). (C) Enhanced reactivity due to hydrophobic interaction. (D) The circle diagrams show the percent contribution of the two factors: the hydrophobic effect (blue) and the pKa effect (red). The 100% represents the sum of the values reported in panels (B,C). The error bars in panels (A–C) are derived from the propagation of uncertainties (see Section 4).

