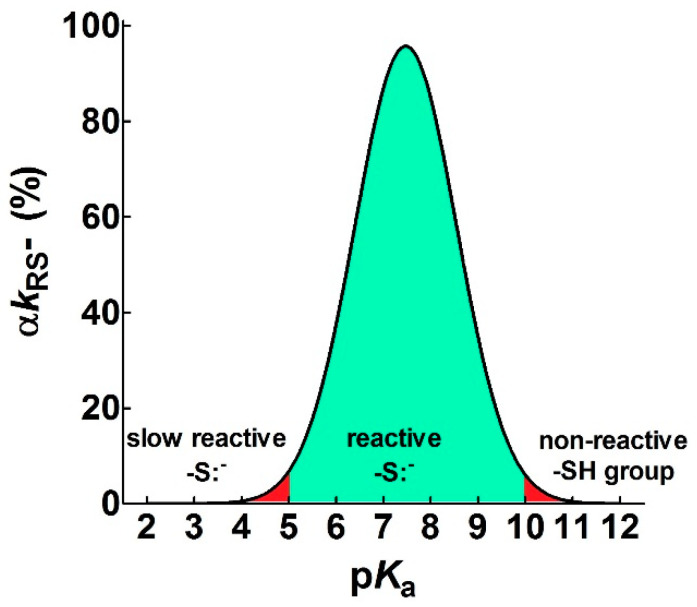
Figure 7.
Theoretical curve defining the range of useful pKa (αkRS− ≥ 5%) for a reacting thiolate group. The figure shows the pKa range that allows a sufficient rate of reaction of a protein cysteine with different reagents (green area) at pH = 7.4. Values with αkRS− < 5% are reported in red. The continuous line represents an average of the experimental curves reported in Figure 1.

