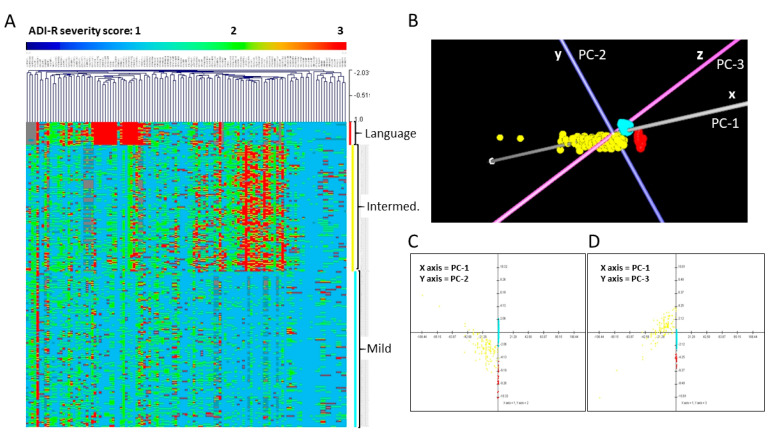
Figure 1.
Separation of probands into three phenotypic subgroups based on cluster analyses of 123 scores on 63 Autism Diagnostic Interview-Revised (ADI-R) items for each individual. (A) Hierarchical clustering (HCL) analysis, (B–D) Principal components analysis (PCA) in 3-d (B) and 2-d projections showing PC-1 and PC-2 (C) and PC-1 and PC-3 (D). For the heatmap in (A), each row represents an individual, while each column represents a score from the ADI-R diagnostic. The range of severity scores (1–3) for each ADI-R item is represented in the color bar above the heatmap, with light blue indicating a score of 1, green-yellow indicating a score of 2, and red indicating a score of 3, which represents the most severe autism spectrum disorder (ASD) manifestation. The three ASD subgroups are identified by the vertical colored bars along the right side of the heatmap, with red indicating the severely language-impaired subgroup, yellow indicating the intermediate subgroup, and turquoise indicating the mild subgroup. This latter set of colors also applies to the subgroups shown in the PCA plots in which each point represents an individual. Note: In the heatmap (A), the large block of red columns associated with the severely language-impaired subgroup primarily corresponds to items involving spoken language on the ADI-R diagnostic.

