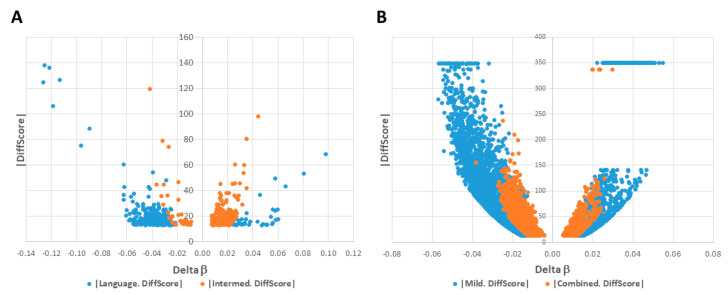
Figure 2.
Volcano plots of significant differentially methylated regions and associated genes (DAGs) among subgroups and combined cases. |DiffScore| versus Delta β plots for significant DAGs in: (A) severely language-impaired (blue) and intermediate (red) subgroups; (B) mild subgroup (blue) and combined cases (red). Note: A |DiffScore| of 13 is roughly equivalent to a p-value of 0.05.

