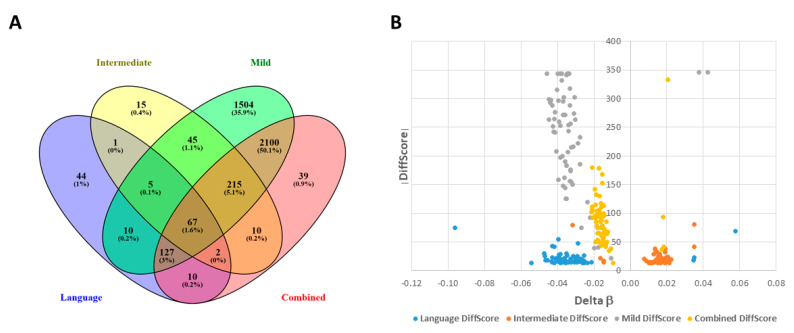
Figure 4.
Stratification of ASD patients (n = 292) into distinct subphenotypes results in increased discovery of significant DAGs. (A) The Venn diagram shows unique significant DAGs that were identified using GenomeStudio Methylation Module v1.8 software with subphenotyping into three groups (mild, intermediate, and severely language-impaired) or without subphenotyping (combined case group) (FDR-adjusted p-values < 0.05). (B) Volcano plots for the 67 overlapping DAGs from each group, identified by color in the accompanying legend.

