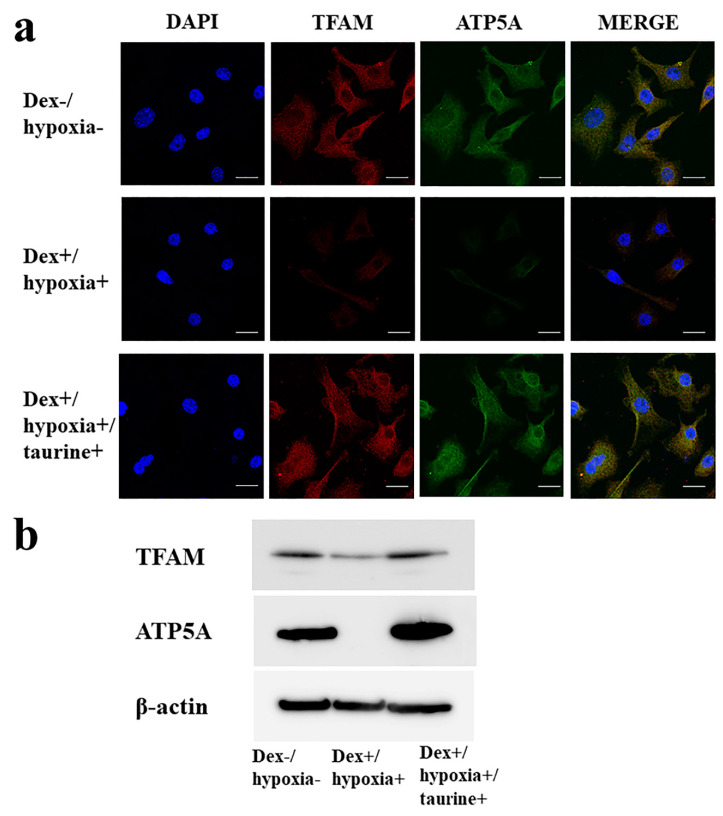
Figure 1.
Mitochondrial transcription factor A (TFAM) and ATP5A expression in cultured osteocytes in an H-D stress environment. (a) Immunocytochemical study, (b) Western blot. TFAM (29 kDa), ATP5A (50–55 kDa), β-actin (42 kDa). In Dex+/hypoxia+ group as compared with Dex−/hypoxia− group, expression of TFAM and ATP5A levels was decreased. In Dex+/hypoxia+/taurine+ group with addition of taurine, as compared with Dex+/hypoxia+ group, levels of both TFAM and ATP5A expression were increased. Scale bar: 20 µm.

