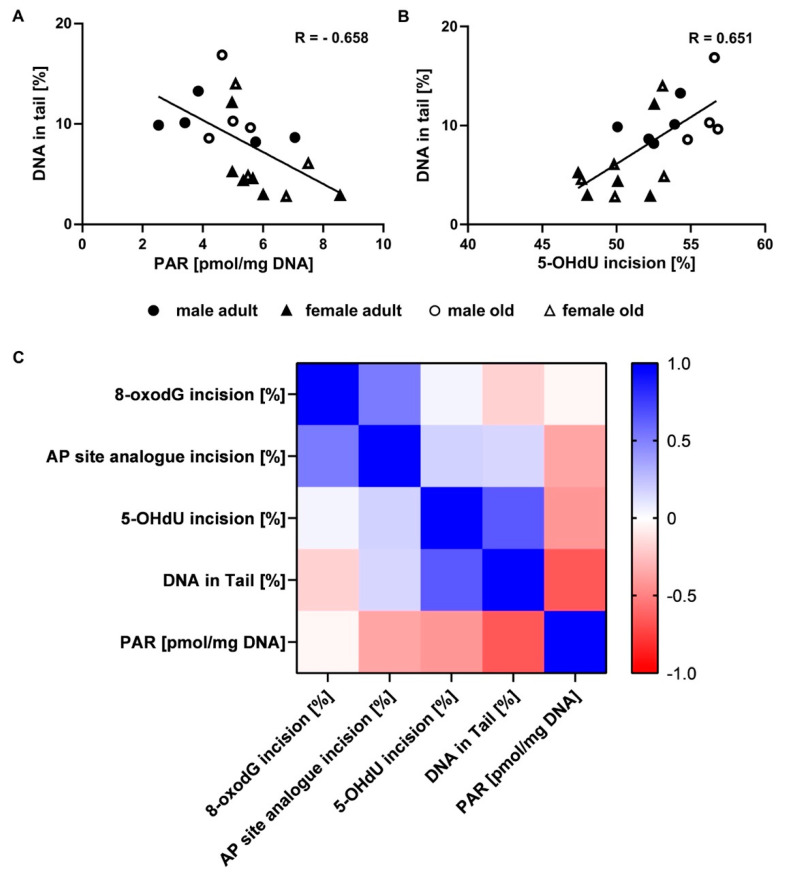
Figure 6.
Relationships between genomic stability endpoints analysed by explorative correlation analysis. DNA damage and PARylation levels showed an inverse relationship (A) (p = 0.002, Spearman’s R = -0.658), while DNA damage levels and incision activity towards the 5-OHdU containing oligonucleotide were positively related (B) (p = 0.003, Spearman’s R = 0.651). The black line represents the linear regression. The correlation matrix-based heat map indicates Spearman’s correlation coefficient R between the analysed genomic stability endpoints (C).

