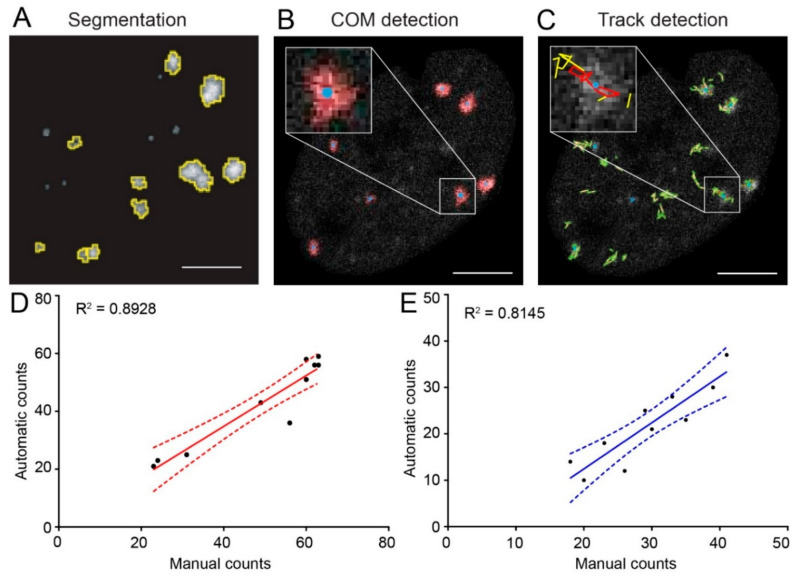
Figure 1.
Overview of focus segmentation and focus track analysis. U2OS cells stably expressing p53-binding protein 1 (53BP1)-GFP were irradiated with 2 Gy of α-particle or X-ray irradiation. (A) ImageJ scripts were using for focus segmentation. (B) Center of mass (COM) per focus was calculated. (C) Center of mass was linked to consecutive frames (if COM was ≤ 0.7 µm). Tracks are indicated in red (active track at this time-point) or yellow (past track not active at this time-point). Scale bar indicates 5 µm. Segmentation of foci was correlated to manual counts of foci for both α-particle irradiation (D) and X-ray irradiation (E). For both treatments, three nonconsecutive frames were counted in 10 random nuclei. The averages of these counts are shown.

