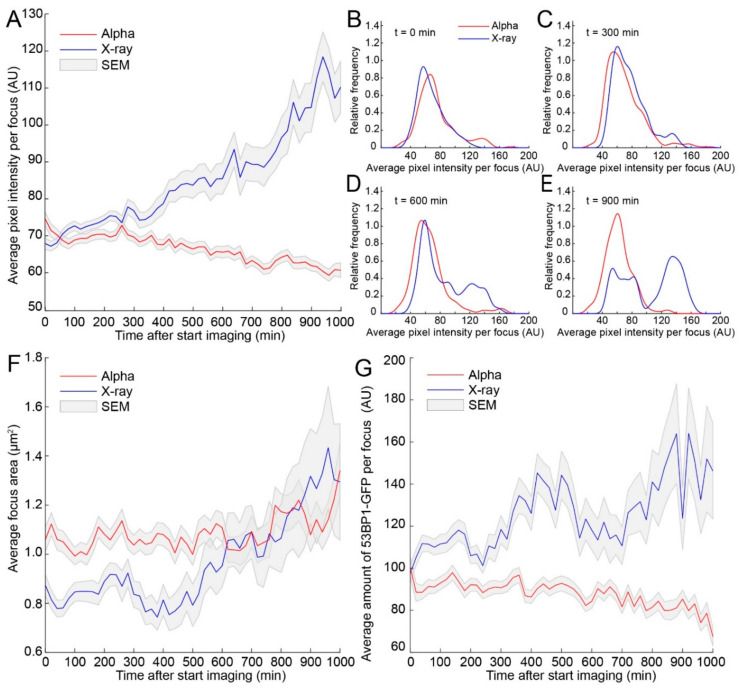
Figure 3.
53BP1-GFP protein accumulation and focus size increase after X-ray irradiation. (A) Average 53BP1-GFP intensity per focus (average pixel intensity) over time after treatment using α-particle (red) or X-ray (blue) irradiation (2 Gy). (B–E) Overview of focus population distribution at 0, 300, 600, and 900 min after the start of imaging. Graphs shown kernel density estimations with the area under the curve being equal to the area of the histogram. The 0 AUs are the consequence of the smoothing procedure used for density estimations. (F) Average 53BP1-GFP focus area trough time. The average of foci induced by α-particles (red) or foci induced by X-ray (blue). (G) Total amount of 53BP1-GFP (product of focus area and pixel intensity) on foci through time after α-particle (red) or X-ray (blue) irradiation. SEM is indicated in gray.

