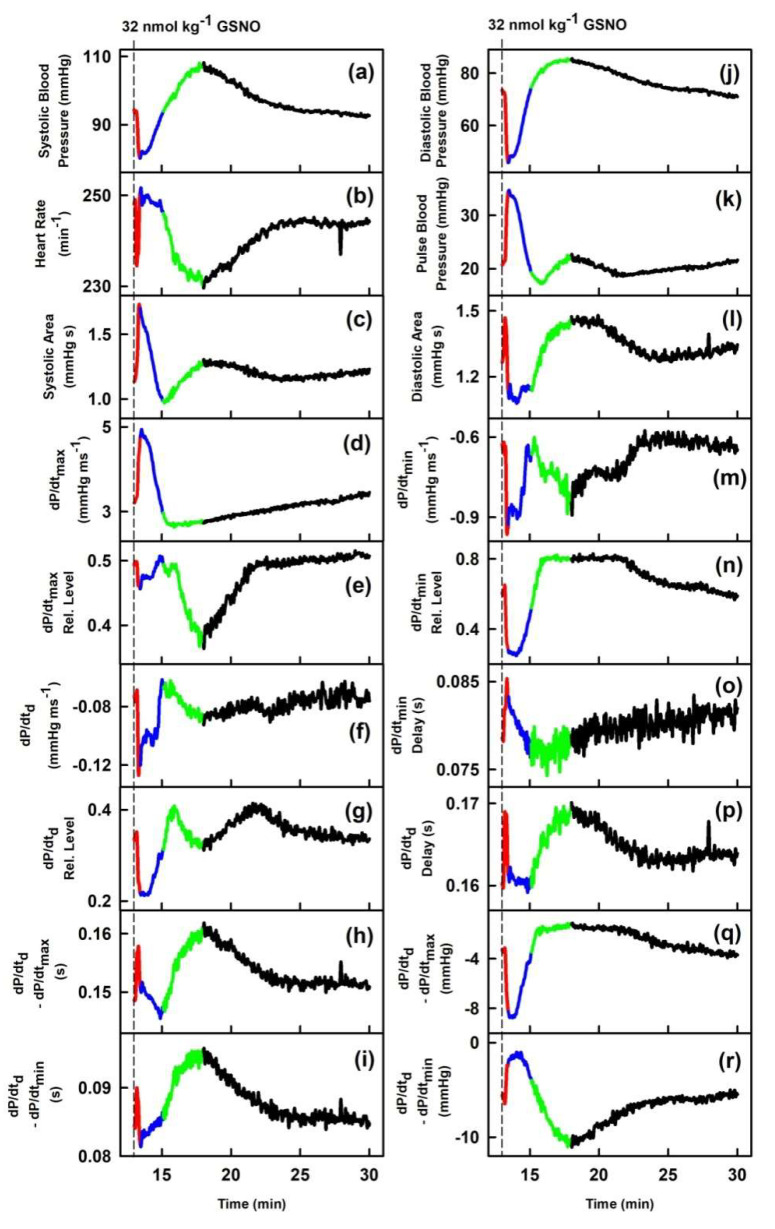
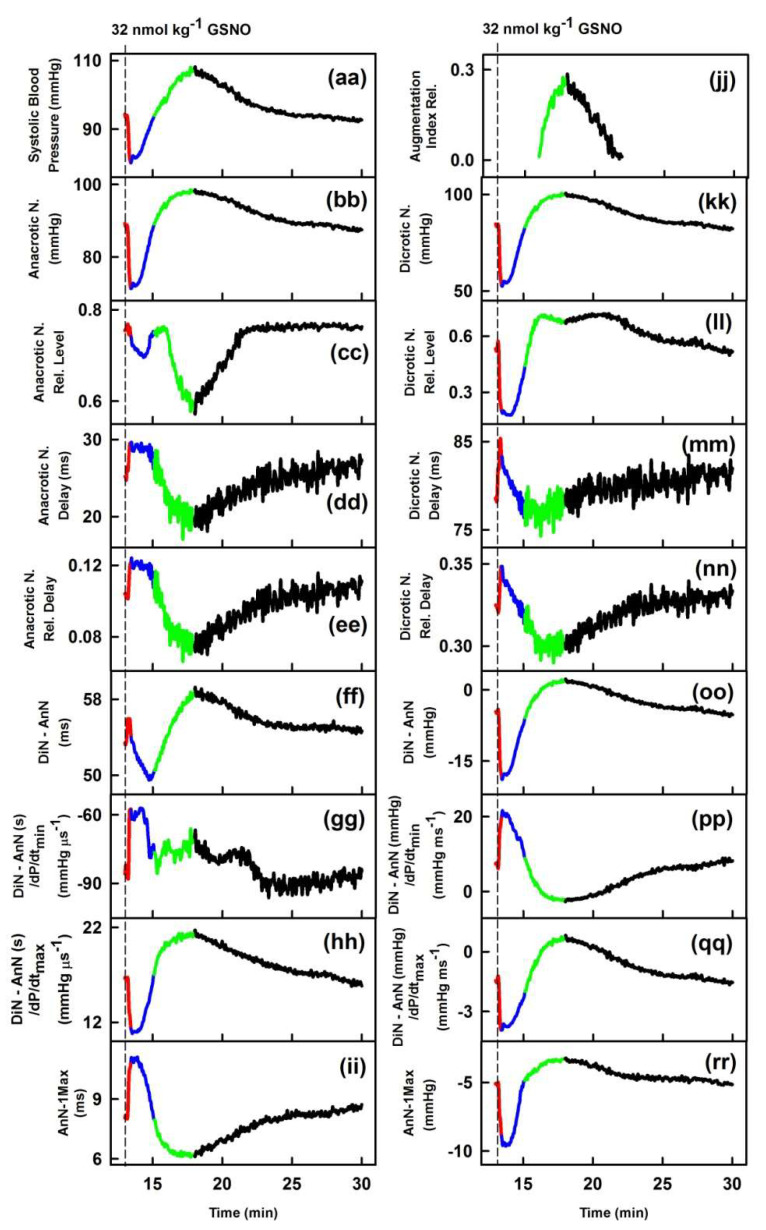
Figure 2.
Time-dependent changes of hemodynamic parameters (HPs) of anesthetized rat after i.v. bolus administration of 32 nmol·kg–1 S-nitrosoglutathione (GSNO) (marked by dash lines). The red line starts 3 s before GSNO administration. Time period corresponding to the decrease of systolic BP (red), increase of systolic BP to the control value (blue), further increase of systolic BP to maximum (green), and decrease of systolic BP to the control value (black). Units in plots (gg), (hh), (pp), and (qq) are informative only.


