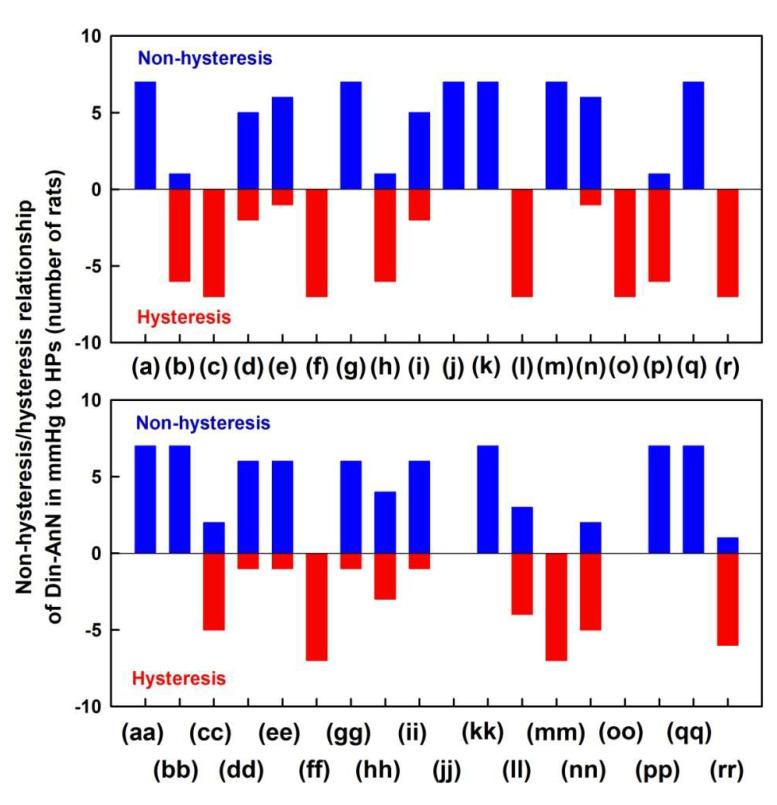
Figure 4.
Non-hysteresis/hysteresis patterns of the two-dimensional relationships of HPs to pressure differences of DiN-AnN in mmHg. Data were taken from Figure 3 and Figure S2 (red and blue lines, which represent the time interval of decrease and increase of BP after administration of 32 nmol·kg–1 GSNO). Number of rats in which non-hysteresis (blue) or hysteresis (red) patterns were observed (n = 7). The hysteresis was arbitrarily defined as HPs-(DiN-AnN in mmHg) loop > 5 mmHg of DiN-AnN (in mmHg).

