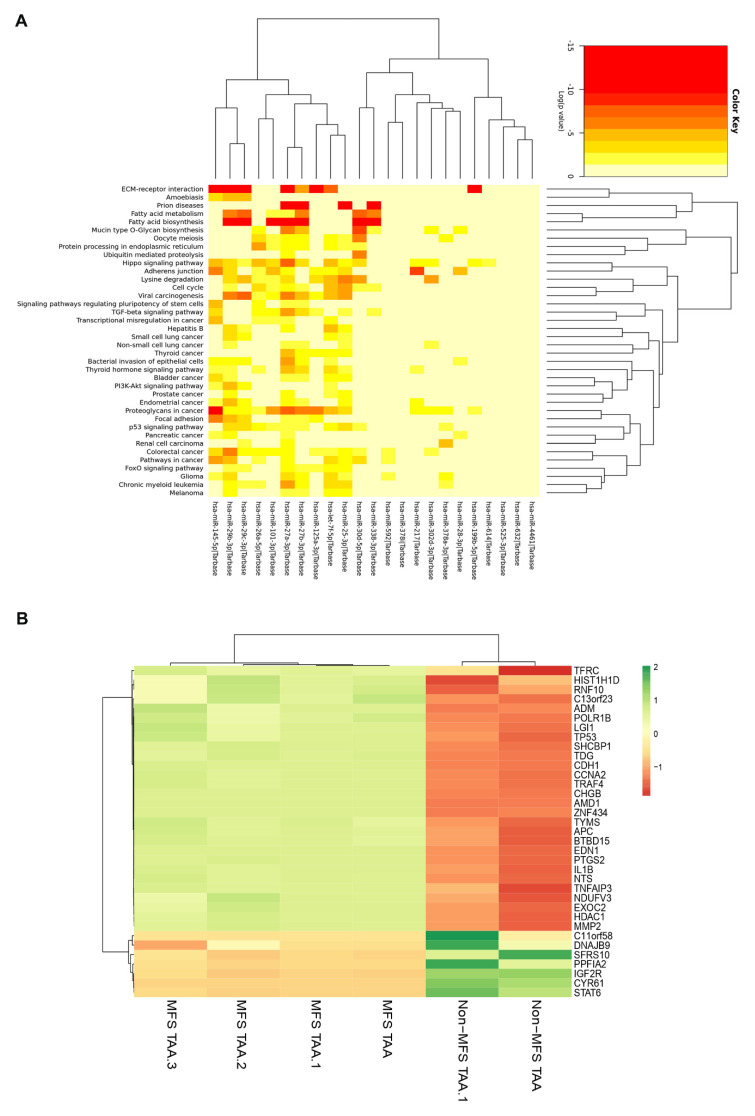
Figure 5.
Representative intersection between deregulated miRNAs and their putative cellular pathways and expression analysis of miRNA target-genes in MFS TAA. (A) Heat map showing putative cellular pathways related to the deregulated miRNAs in MFS TAA medial tissue (MFS TAA, n = 4; non-MFS TAA, n = 4). Each column represents a single miRNA. (B) Heat map shows differential gene expression in MFS TAA medial tissue (n = 4) compared with non-MFS TAA (n = 2). Red indicates downregulation and green indicates upregulation of genes. Black suggests no significant changes in gene expression levels.

