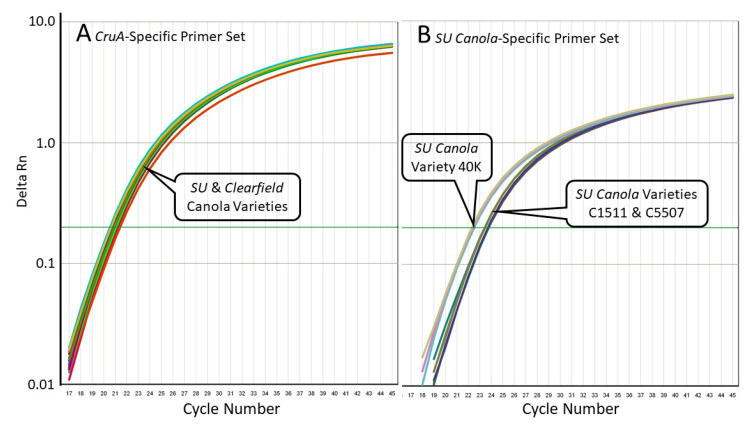
Figure 4.
Quantitative PCR amplification curves for the results shown in Table 2, with primers specific for the CruA gene (Panel (A)) or with primers specific for the SU canola AHAS1C-SU gene (Panel (B)). In Panel (B), amplification occurred only with the SU canola varieties 40K, C1511, and C5507, while in Panel (A), amplification also occurred with the Clearfield canola varieties.

