
Figure 4.
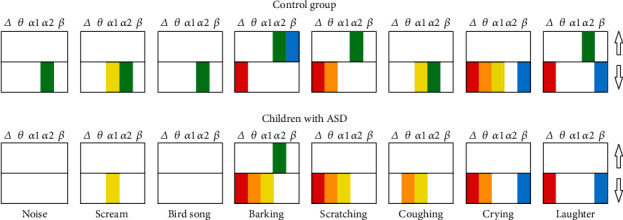
The PSD differences between stimuli and rest for delta (2-4 Hz), theta (4-8 Hz), alpha1 (8-10 Hz), alpha2 (10-12 Hz), and beta (12-20 Hz) bands. The colored columns depict significant differences which were supported by the clustering permutation test and passed Bonferroni correction. Arrows (up and down) indicate an increase and decrease compared to the background.