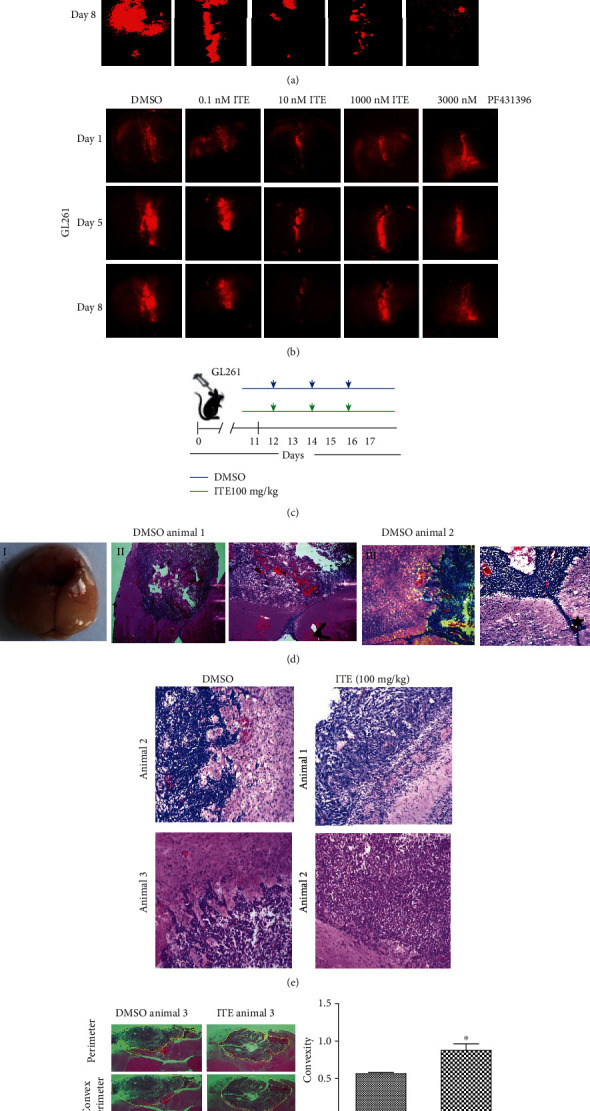
Figure 2.

ITE blocked glioma cell invasion into the brain parenchyma in an ex vivo brain slice model and an orthotopic mouse model of glioma. (a) Whole-brain images of labeled GL261 cells invade into cultured mouse brain slices. (b) Cells were incubated with CM-Dil Dye, seeded into the seam of two adjacent brain slice halves cultured at the air-liquid surface with DMSO, a various dosage of ITE, or FAK inhibitor PF431396. Representative whole-brain slice images were obtained on day1, day5, and day8. High-resolution brain slice culture images obtained by stitching overlapping images. (c) Experimental design and treatment schema. (d) Glioma invasion observed in the orthotopic mouse model. (I) Gross appearance of a mouse brain with a glioma in the cerebrum. (II) Representative images of whole-brain horizontal frozen sections with H&E staining showing glioma invasion toward the ventricles. (III) Representative image showing glioma invasion into the brain parenchyma and toward the blood vessel. Arrows, ventricles. Asterisk, invading tumor cells at the tumor edge. Star, blood vessel. (e) Local invasion patterns at tumor edges of the ITE or DMSO group. Tumor-bearing mice were treated with DMSO or 100 mg/kg body weight ITE and were euthanized. Horizontal brain sections from two animals per group were shown. (f) Convexity of the tumor shape in brain tissue sections as a measure of tumor invasion. The convexity of the tumor was done by first finding the edge of the tumor using ImageJ, then measure the perimeter and convex perimeter of the tumor shape, and t-test was applied for data analysis.
