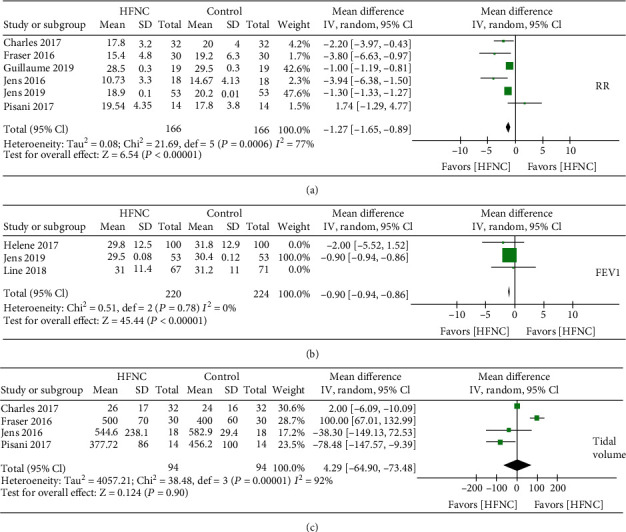
Figure 3.

(a) Forest plot of mean difference of the respiratory rate in HFNC arm compared with control arm. (b) Forest plot of mean difference of FEV1 in HFNC arm compared with control arm. (c) Forest plot of mean difference of tidal volume in HFNC arm compared with control arm.
