Figure 4.

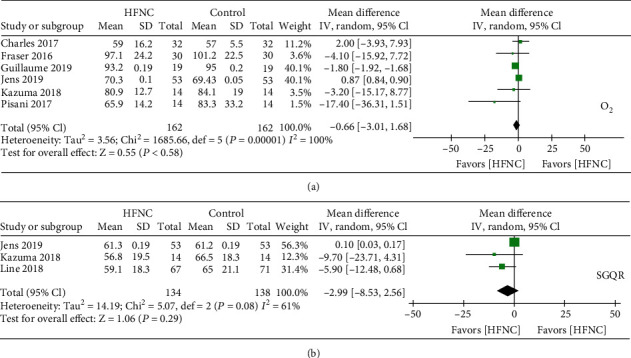
(a) Forest plot of mean difference of the oxygen partial pressure in HFNC arm compared with control arm. (b) Forest plot of mean difference of total score of St. George's respiratory questionnaire in HFNC arm compared with control arm.

(a) Forest plot of mean difference of the oxygen partial pressure in HFNC arm compared with control arm. (b) Forest plot of mean difference of total score of St. George's respiratory questionnaire in HFNC arm compared with control arm.