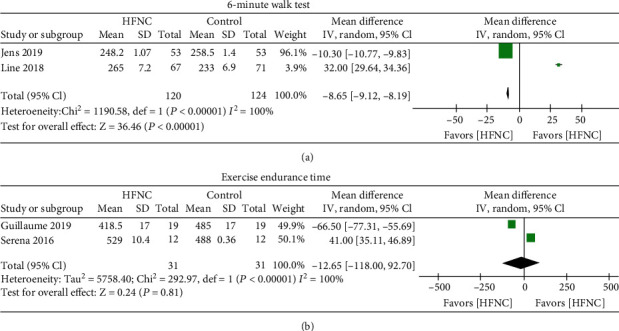
Figure 5.

(a) Forest plot of mean difference of the 6-minute walk test in HFNC arm compared with control arm. (b) Forest plot of mean difference of exercise endurance time in HFNC arm compared with control arm.

(a) Forest plot of mean difference of the 6-minute walk test in HFNC arm compared with control arm. (b) Forest plot of mean difference of exercise endurance time in HFNC arm compared with control arm.