Figure 4.

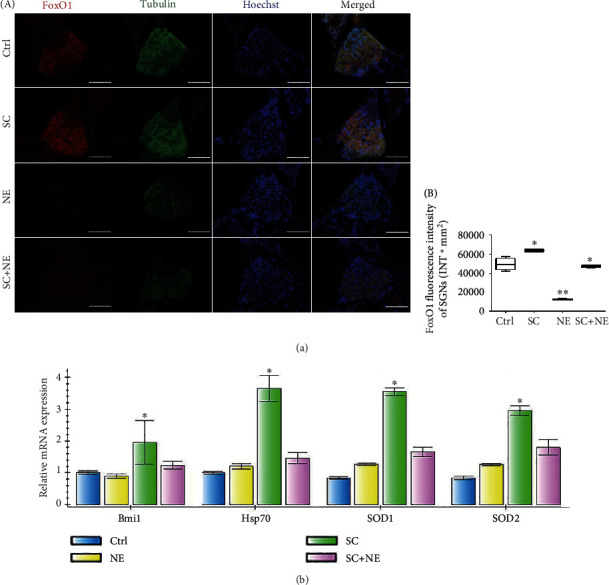
FoxO1 protein and Hsp70, Bmi1, SOD1, and SOD2 mRNA expressions of SGNs after sound conditioning and acute noise exposure. Distributions and expressions of FoxO1 (a) protein were detected with the immune-fluorescence assay in the Ctrl and SC groups as well as the NE and SC+NE groups (A), while the quantity of these protein expressions was analyzed by fluorescence intensity (B). FoxO1 (red) and tubulin (green) as SGN marker were, respectively, labeled with fluorescent secondary antibody, and nuclei (blue) were labeled with Hoechst. Scale bars represent 100 μm (a). Statistical analysis of the results presented in (B) was performed with one-way ANOVA (FoxO1: F = 155.3, P < 0.0001), followed by Newman-Keuls' post hoc test (∗P < 0.05, ∗∗P < 0.05; n = 6 pictures from 3 animals/group). Furthermore, values are means ± SD. Relative mRNA expressions of Bmi1, Hsp70, SOD1, and SOD2 were determined by quantitative RT-PCR (b). β-Actin RNA level was used as an endogenous control. Values are means ± SD (n = 6 animals/group). ∗P < 0.05 vs. control group.
