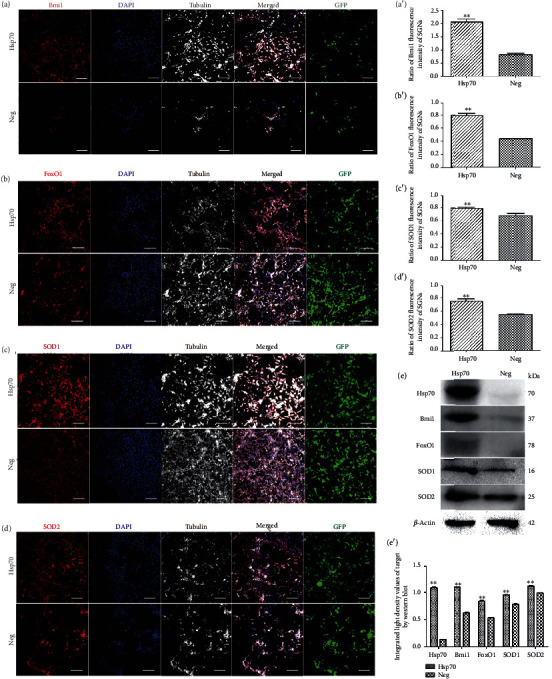
Figure 7.

Bmi1, FoxO1, SOD1, and SOD2 expressions of overexpressed HSP70 SGNs. Distributions and expressions of Bmi1, FoxO1, SOD1, and SOD2 protein in SGNs were detected with the immune-fluorescence assay in the Hsp70-overexpressing adenovirus and negative control groups (a–d), while the quantity of these protein expressions was analyzed by the ratio of fluorescence intensity (a′–d′). After successful transfection by Hsp70-overexpressing adenovirus or empty vector adenovirus as GFP (green) shown, Bmi1/FoxO1/SOD1/SOD2 (red) and tubulin (white) as SGN marker were, respectively, labeled with fluorescent secondary antibody and nuclei (blue) were labeled with DAPI. Scale bars represent 100 μm. SGNs expressing a green fluorescent protein (GFP) coded in the same vector as the Hsp70-overexpressing vector was coupled to the GFP sequence, indicating that 66.7% ± 7.8% (n = 4 independent cell culture preparations) of the neuronal cells present in the cultures were transfected with Hsp70. Therefore, ratios of Bmi1, FoxO1, SOD1, and SOD2 fluorescence intensity to GFP were calculated. Furthermore, values are means ± SD (N = 40 animals from 2 groups). ∗∗P < 0.05 vs. negative group. Statistical analysis of the results presented in (a′–d′) was performed with Student's t-test (∗∗P < 0.05; N = 40 animals from 2 groups). After successful transfection by Hsp70-overexpressing adenovirus or empty vector adenovirus, protein expressions of Hsp70, Bmi1, FoxO1, SOD1, and SOD2 were assessed with western blot (e), while the quantity of these protein expressions was analyzed by integrated light density (e′). β-Actin protein was available as an endogenous control. Furthermore, values are means ± SD. ∗∗P < 0.05 vs. negative group. Statistical analysis of the results was performed with two-way ANOVA (interaction: F(4, 20) = 459.8; P < 0.0001; row factor: F(4, 20) = 493.74; P < 0.0001; column factor: F(1, 20) = 3400.31; P < 0.0001), followed by Student's t-test (∗∗P < 0.05; n = 12 animals/group).
