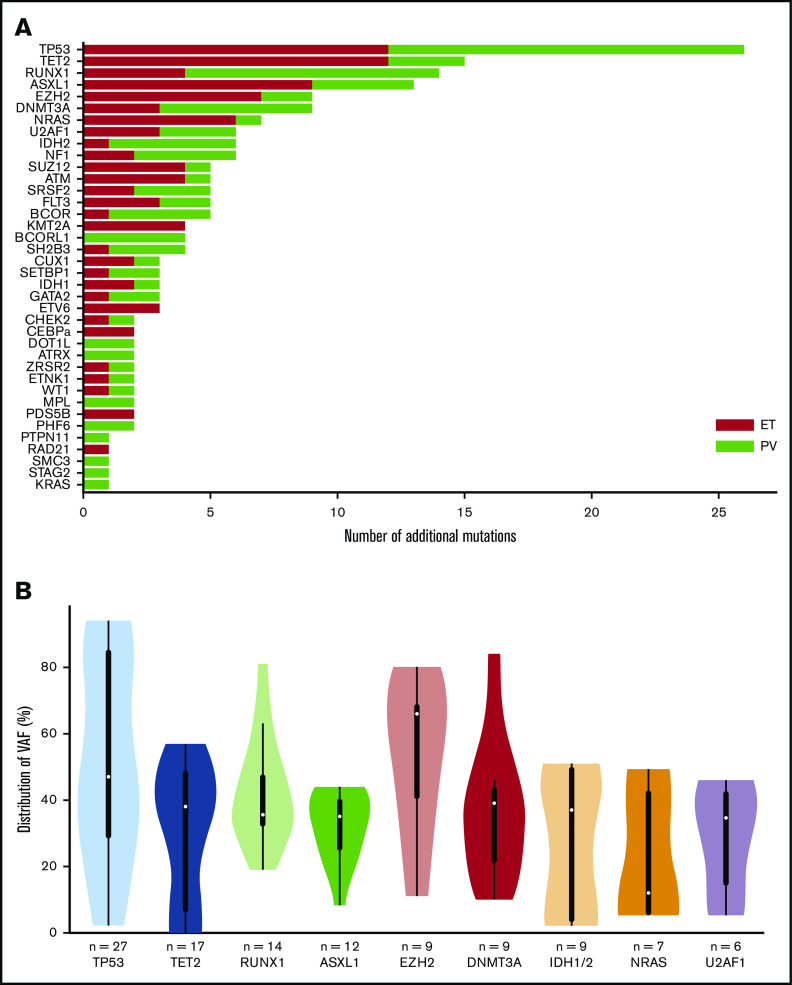
Figure 1.
Genes mutated at the time of leukemic evolution of MPNs. (A) The total number of mutations is represented. Mutations in post-PV AML are in red, and those in post-ET AML are in green. (B) Violin plots of the VAF distribution of genes with more than 6 mutations. IDH1 and IDH2 have been summed for this figure.

