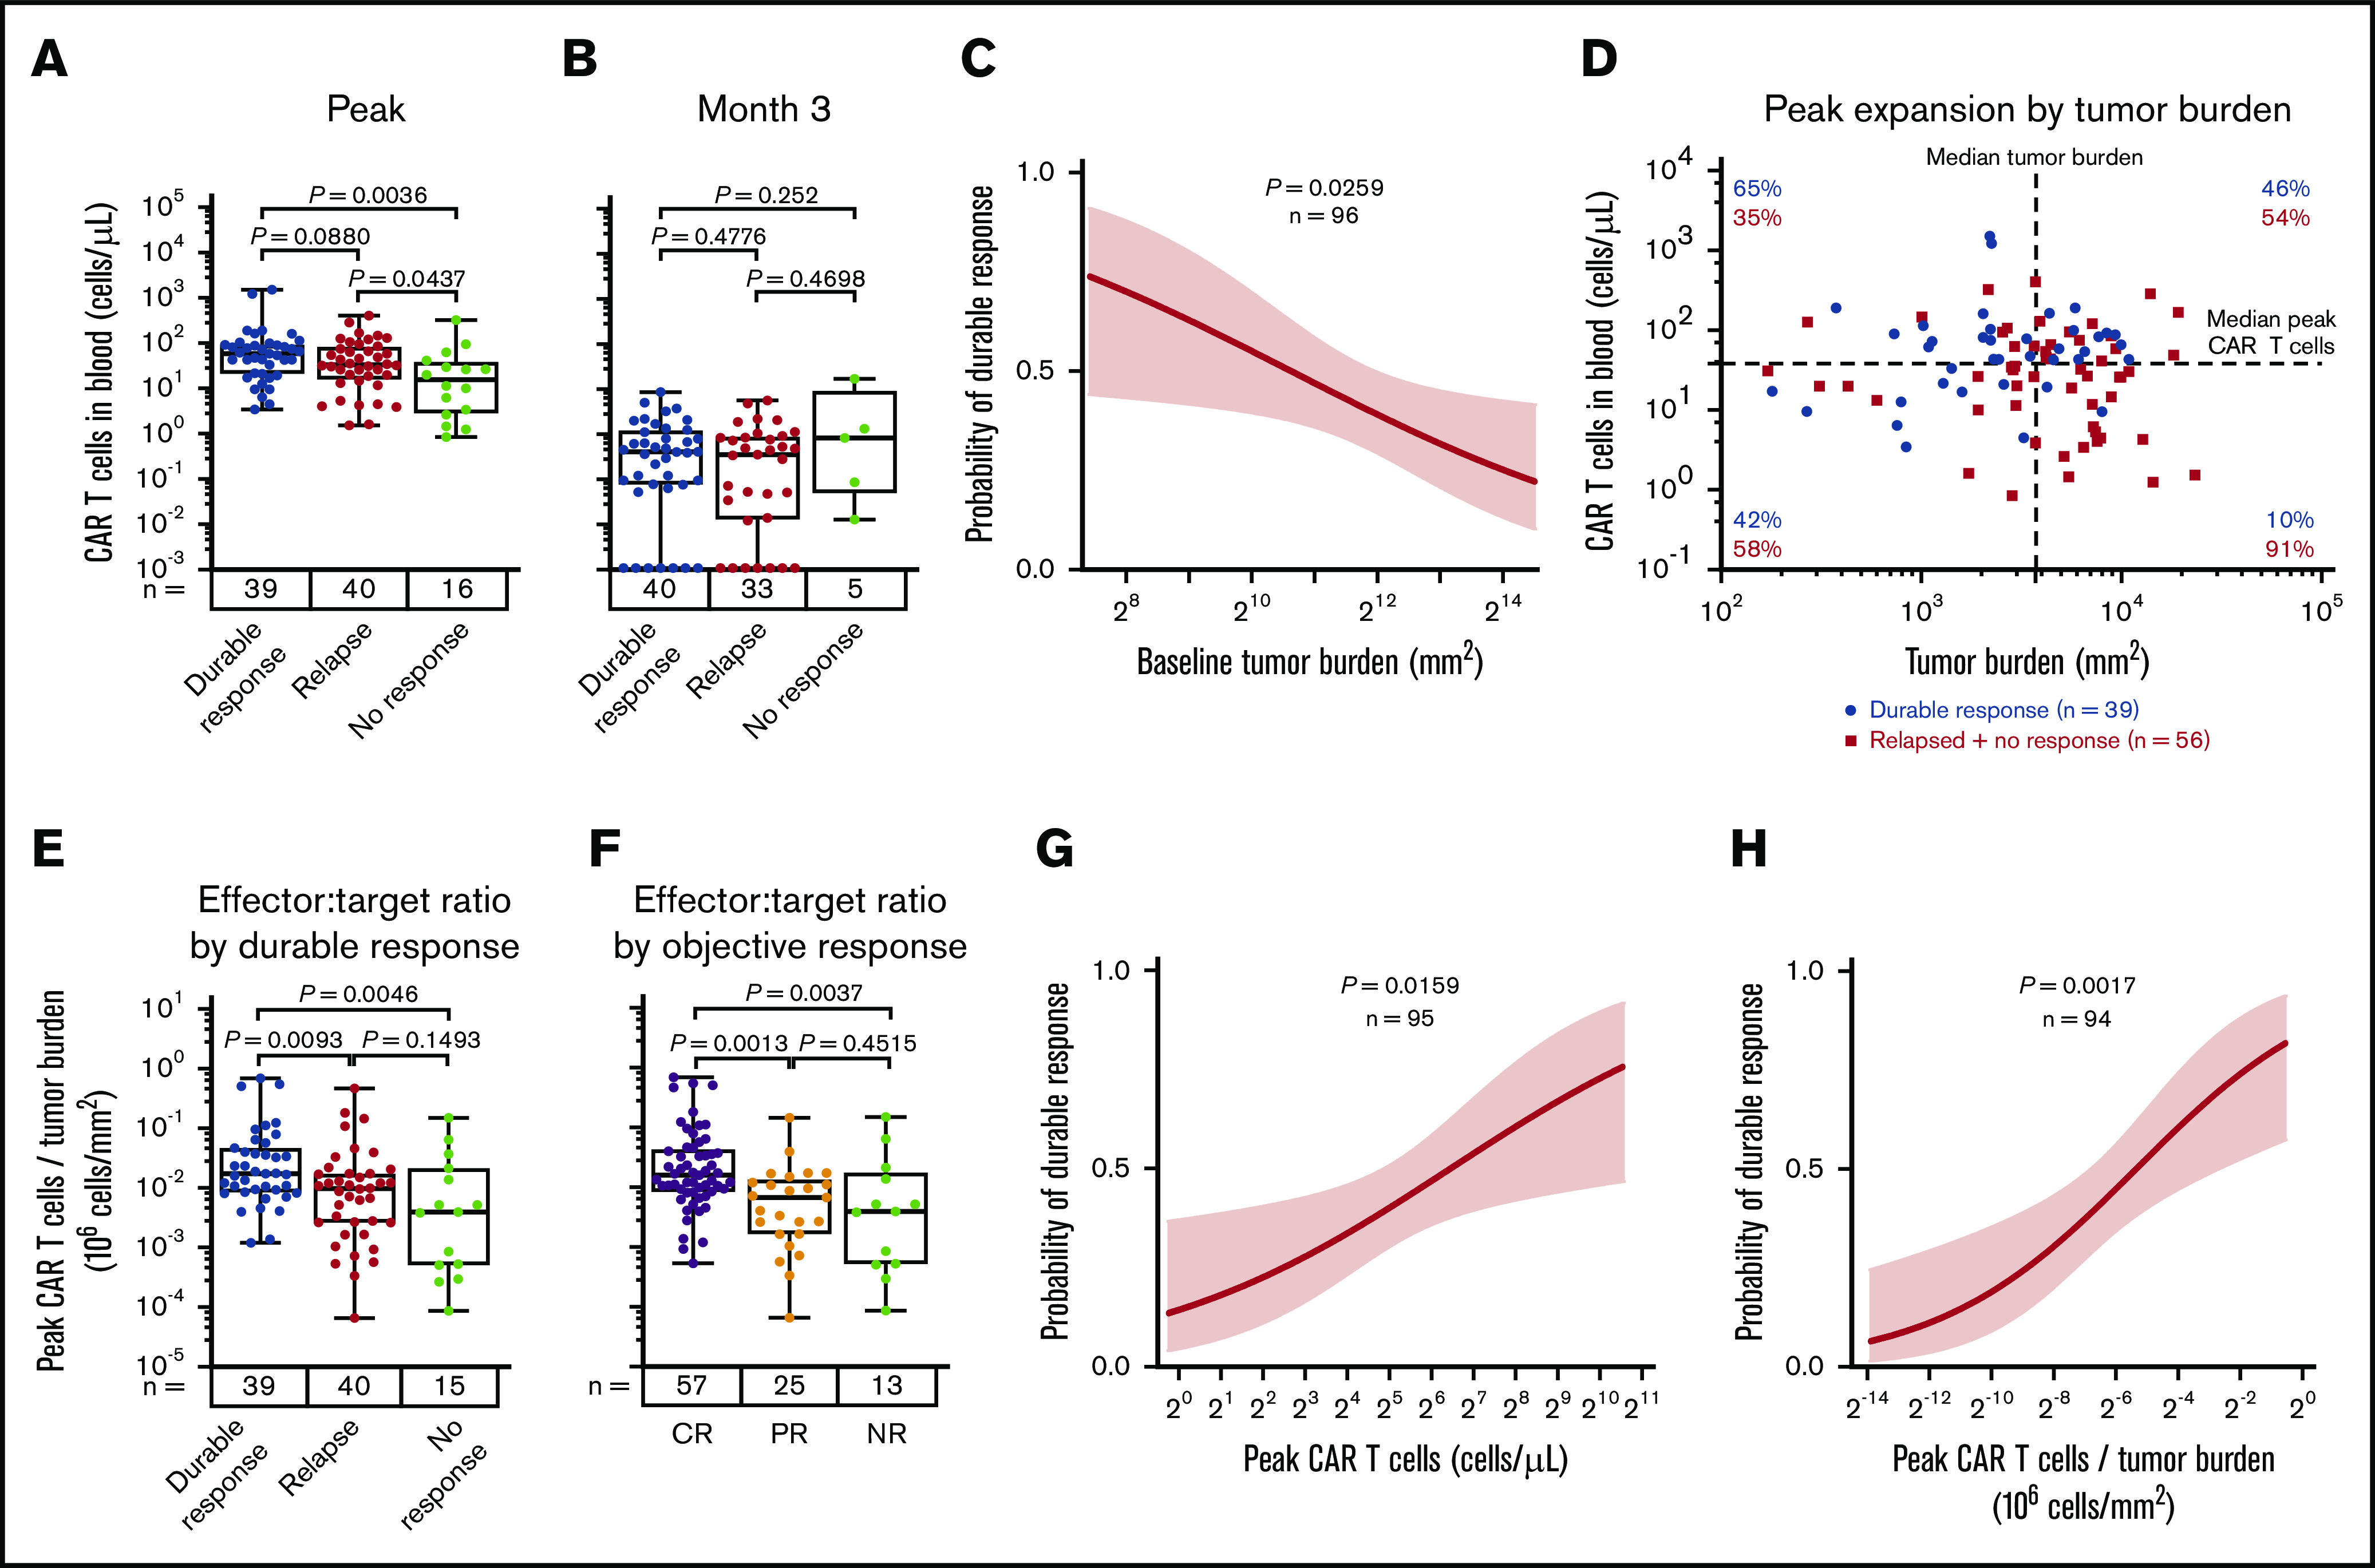
Figure 1.

CAR T-cell expansion commensurate with baseline TB is associated with durable responses after axi-cel. Analysis of peak (A) and 3-month CAR T-cell expansion (B) by response status. (C) The association of baseline tumor and probability of durable response was assessed by logistic regression. (D) Scatter plot of baseline TB and peak CAR T-cell levels. (E-F) Analysis of peak CAR T-cell levels normalized to TB by response status. Logistic regression analysis evaluating the association of durable response with peak CAR T-cell levels (G) and peak CAR T-cell levels (H) normalized to TB. P values were calculated using Kruskal-Wallis and Dunn’s tests. CR, complete response; NR, no response; PR partial response.
