Figure 1.

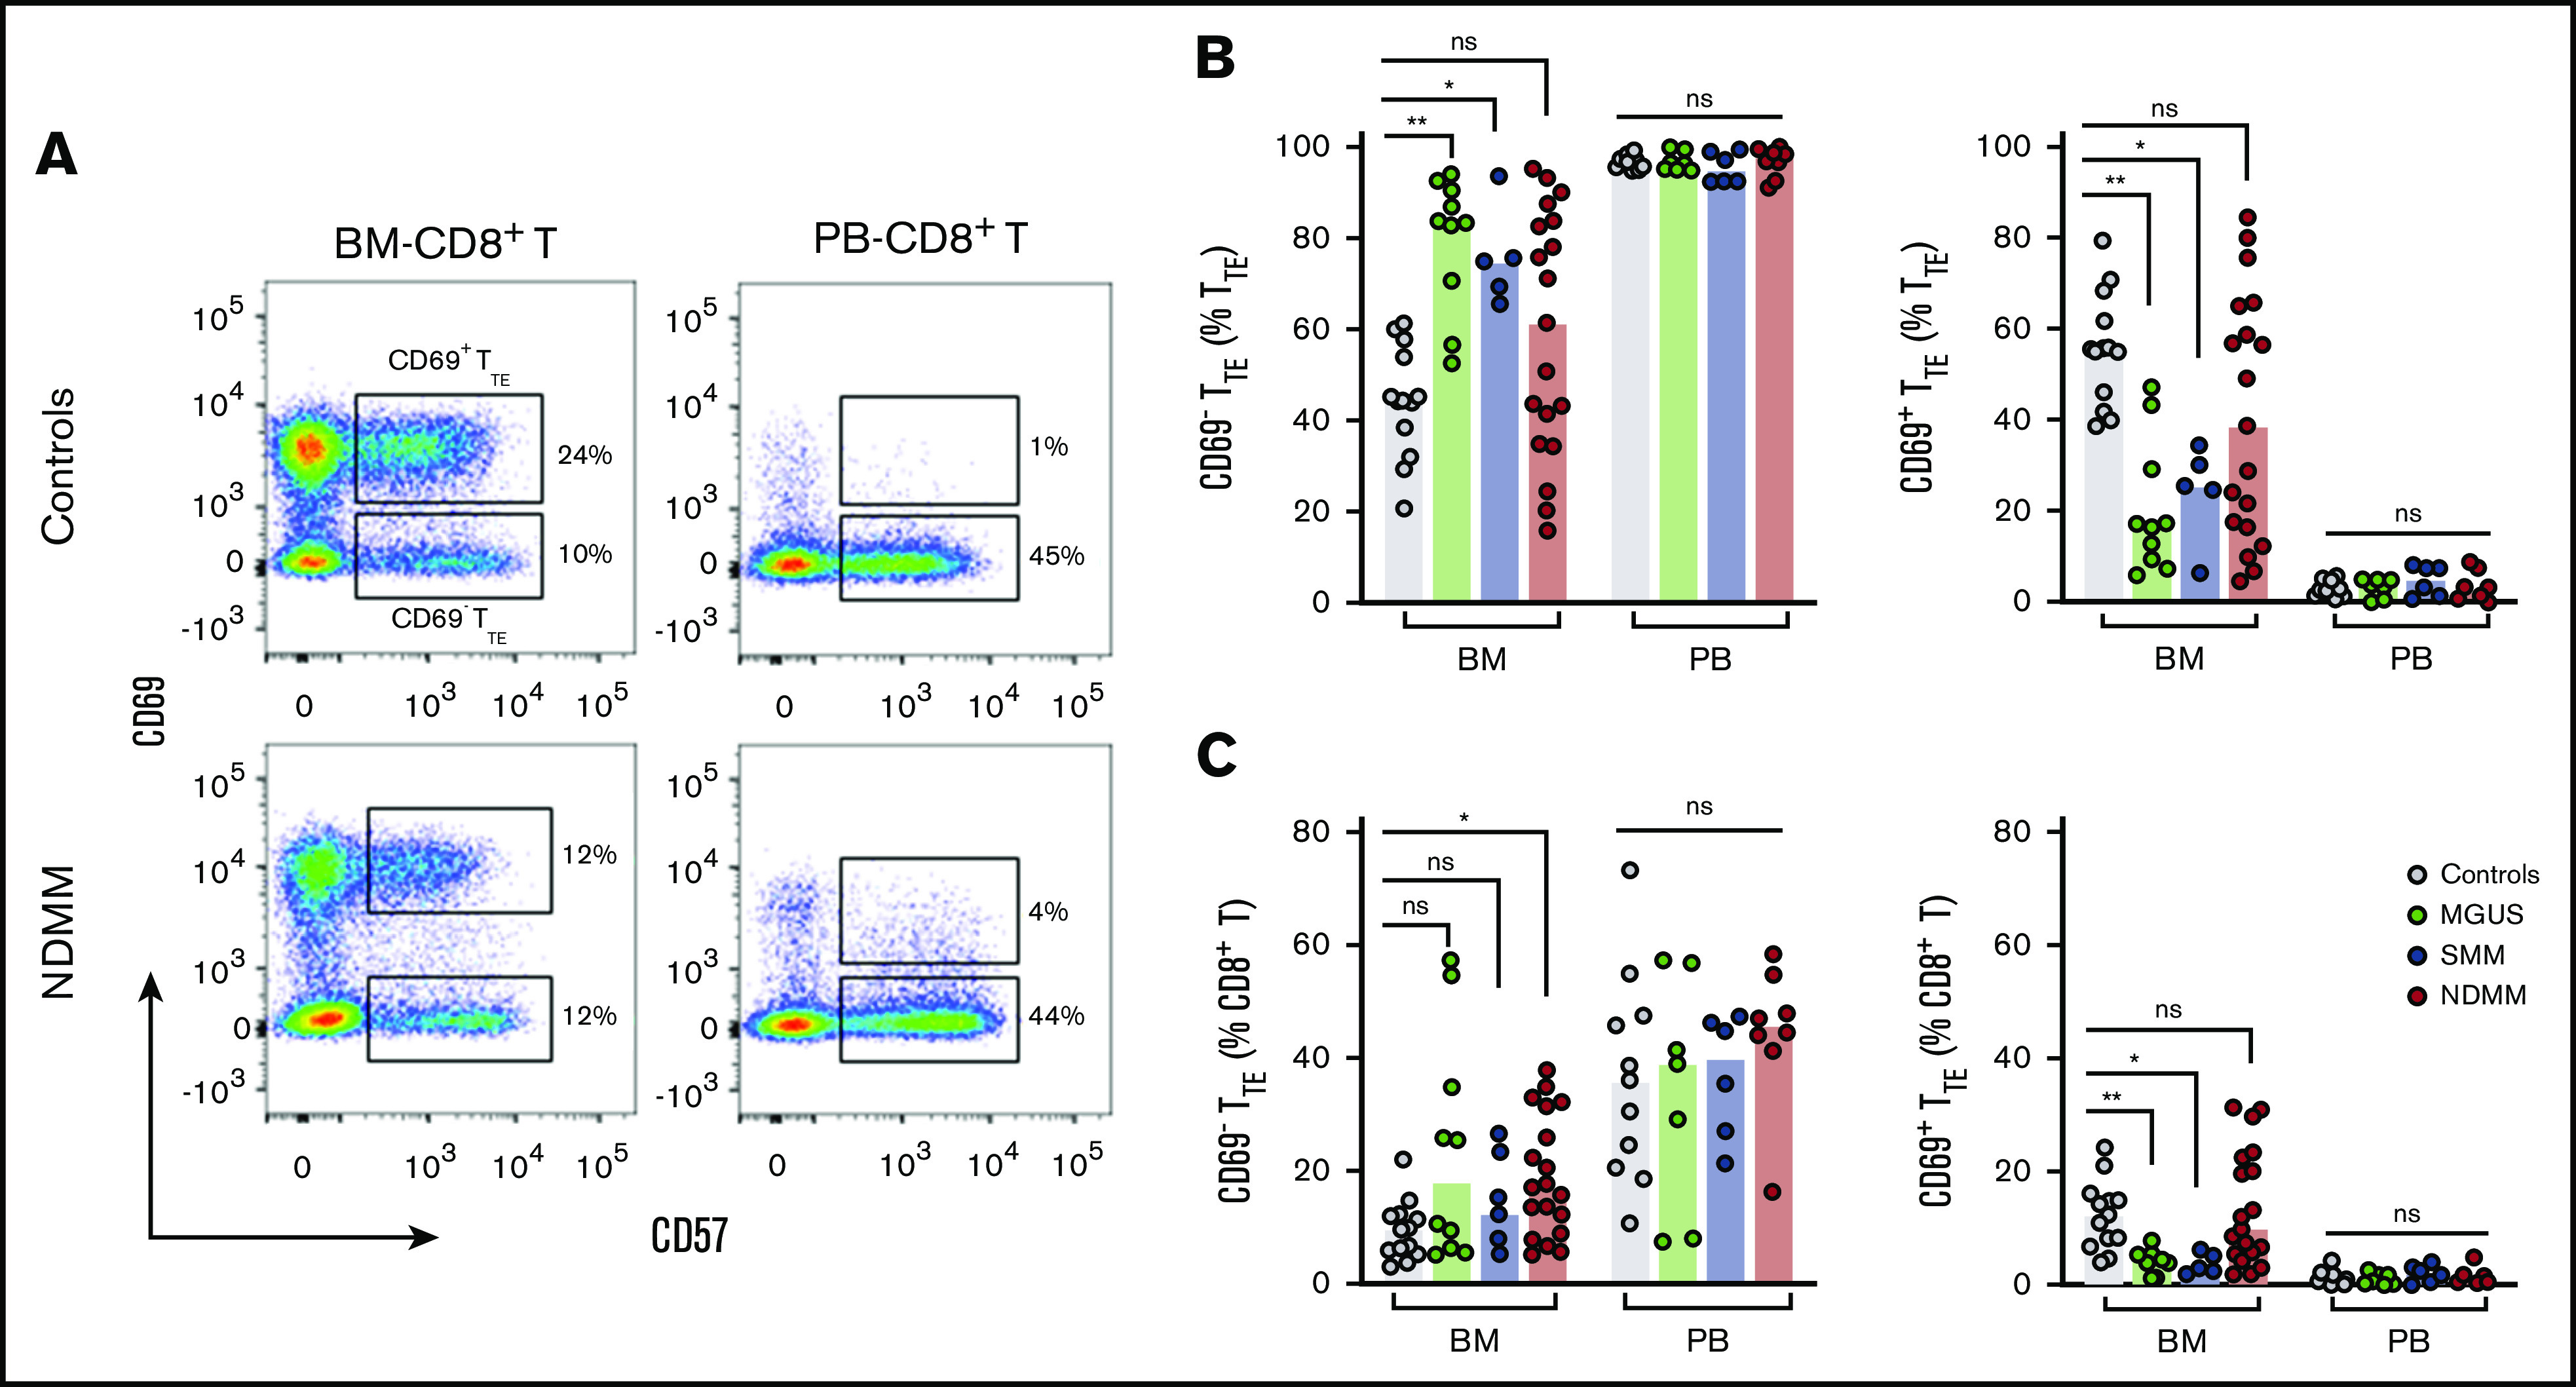
Tissue distribution of CD69−TTEand CD69+TTEcells in controls and MGUS, SMM, and NDMM patients. (A) Representative dot plots gated for CD8+T cells show distribution of CD69+TTE and CD69−TTE cells in the BM and PB of controls and NDMM patients. Regions occupied by CD69+TTE and CD69−TTE cells are indicated. Numbers indicate proportions of CD69+TTE and CD69−TTE cells within BM-CD8+T and PB-CD8+T cells. Bars (median with scatter plots) show proportions of CD69−TTE and CD69+TTE cells within TTE (B) and CD8+T (C) cells in the BM of controls (n = 13), MGUS patients (n = 10), SMM patients (n = 5), and NDMM patients (n = 19) and PB of controls (n = 13), MGUS patients (n = 7), SMM patients (n = 6), and NDMM patients (n = 8). *P < .05; **P < .01; Kruskal-Wallis test with Dunn’s multiple comparisons. ns, not significant.
