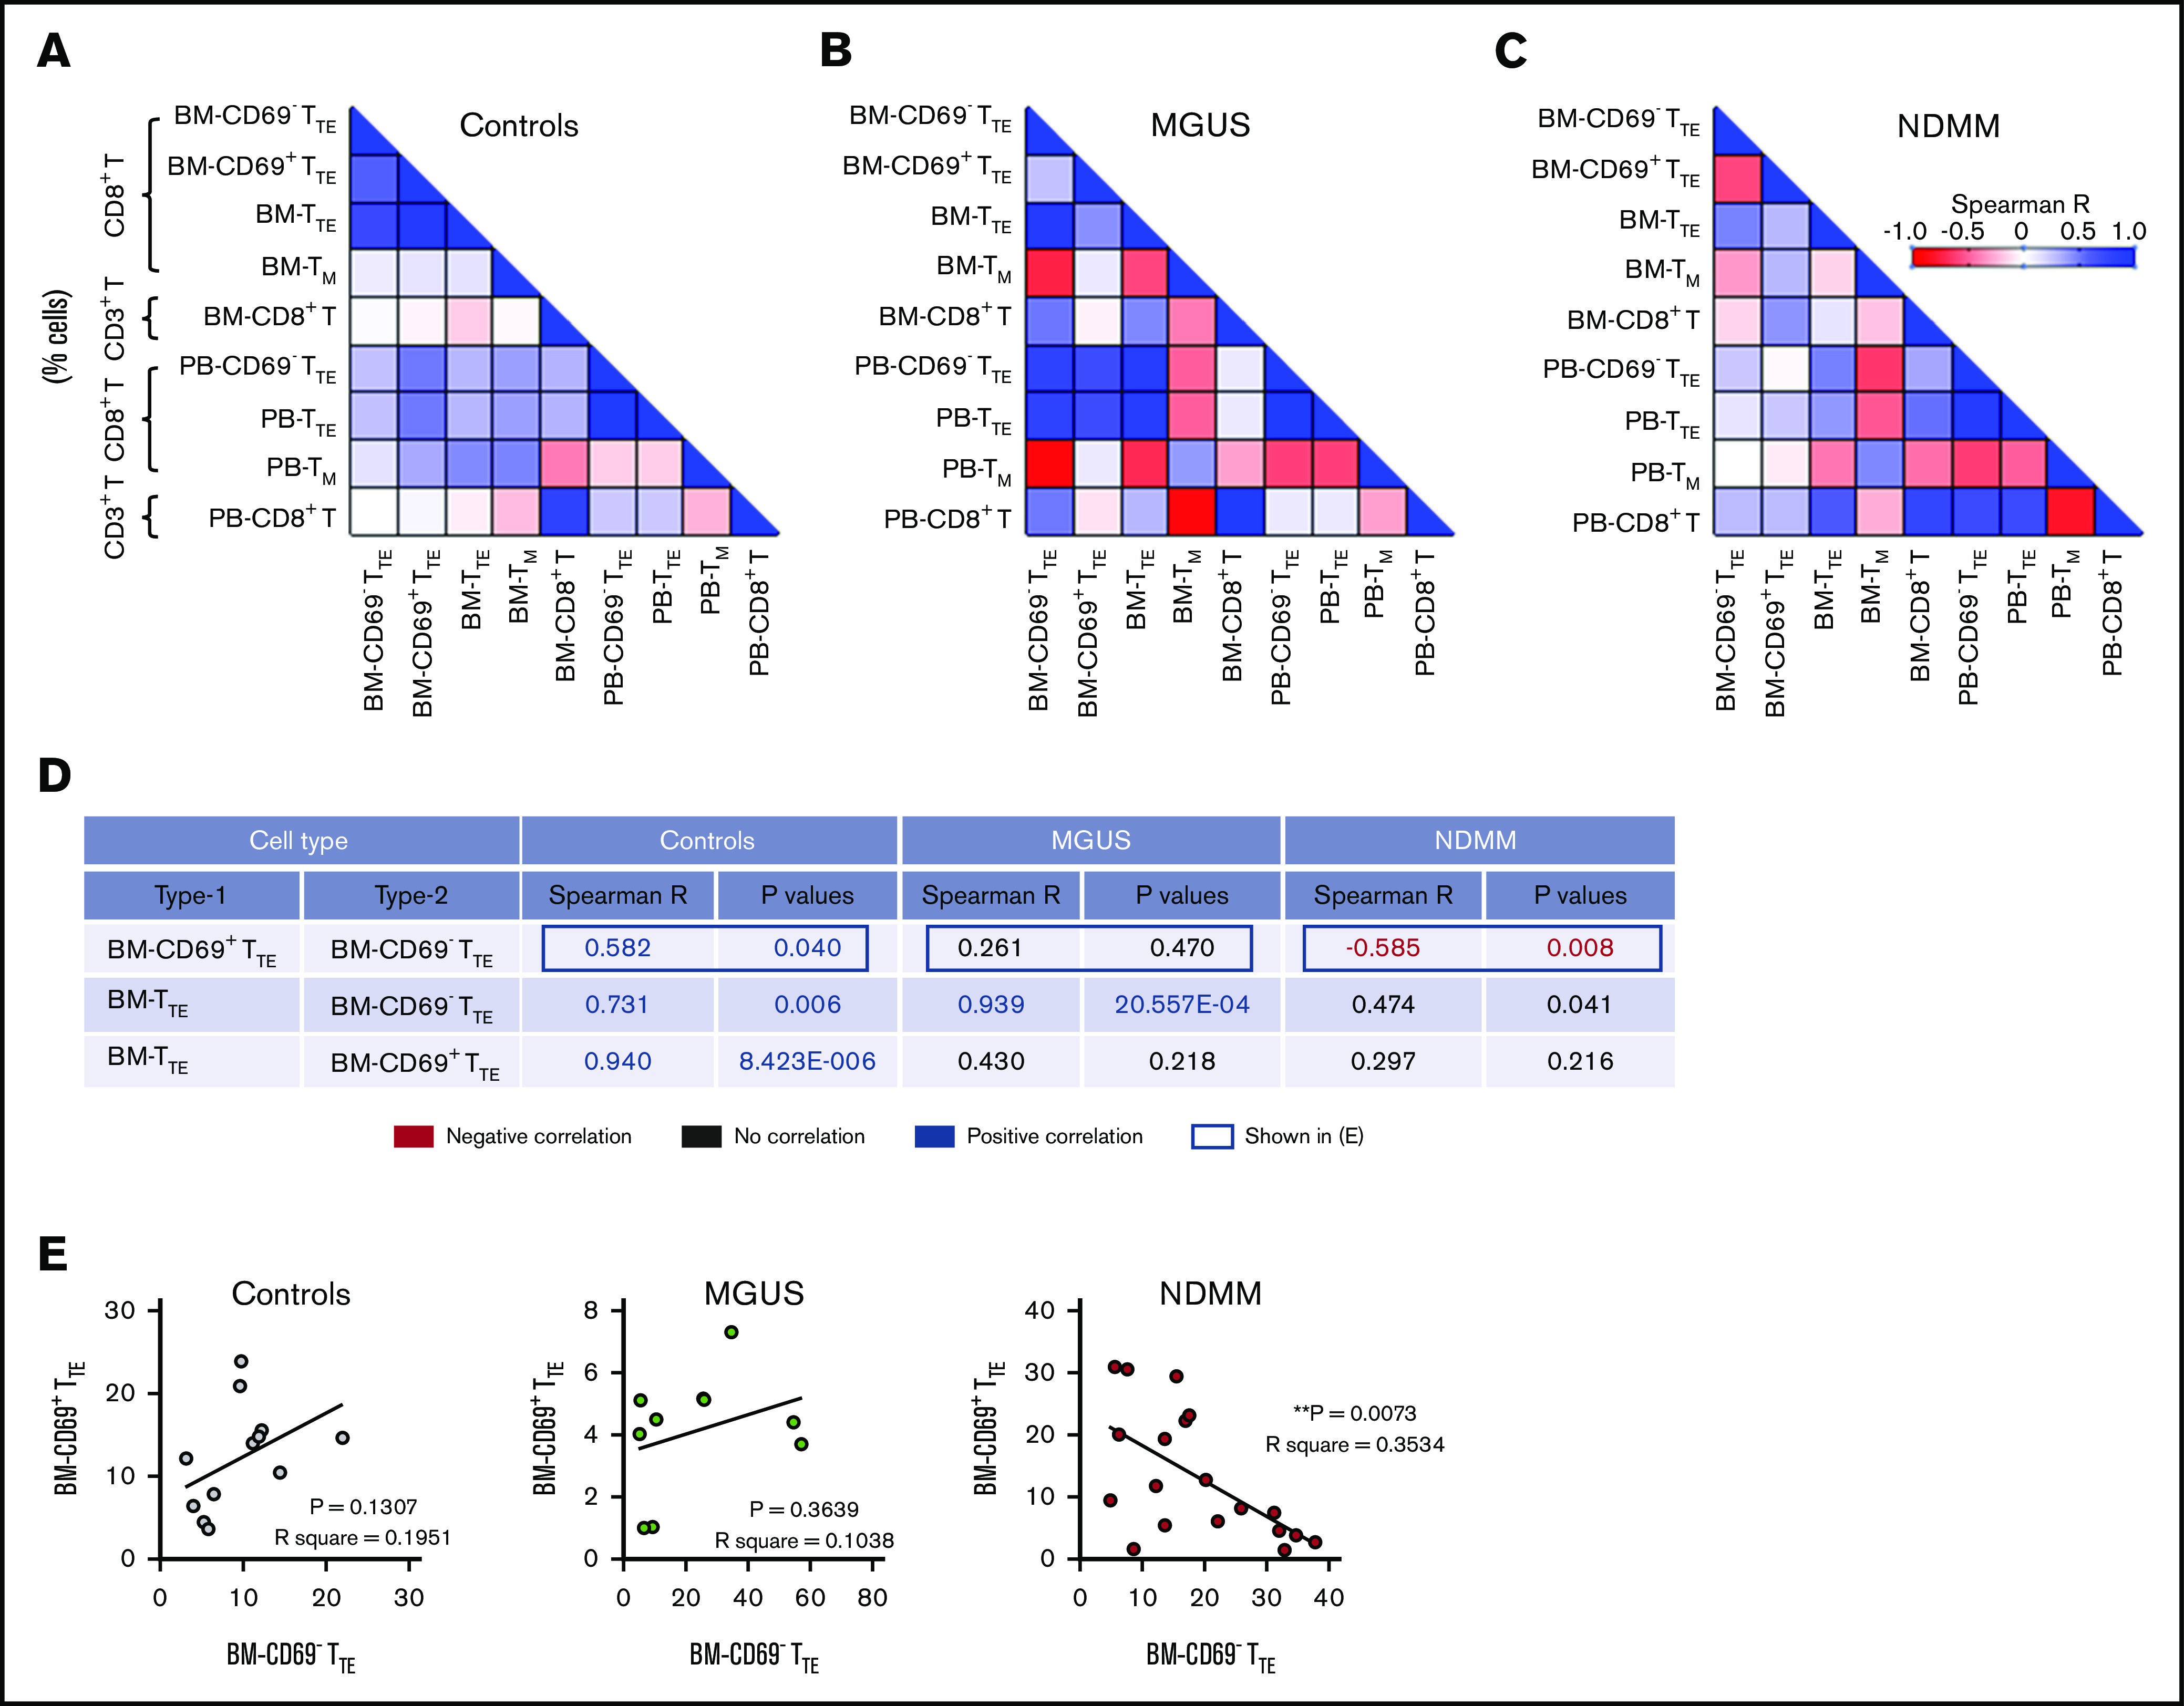
Figure 2.

Relationships between proportions of CD69−TTE, CD69+TTE, TTE,TM, and CD8+T cells in controls and MGUS and NDMM patients. (A-B) The matrix shows correlations between proportions of CD69−TTE, CD69+TTE, TTE, TM (CD8+CD45RO+CD57−), and CD8+T cells in the BM and PB of controls (A), MGUS patients (B), and NDMM patients (C). Proportions of CD69−TTE, CD69+TTE, TTE and TM are presented as % CD8+T cells and proportion of CD8+T as % CD3+T cells. (D) The table shows selected significant negative (in red) and positive (in blue) correlations depicted from panels A-C with Spearman R < −0.5 and > 0.5 and P < .05. (E) Relationships between paired proportion of CD69+TTE and CD69−TTE cells in BM of controls (left), MGUS patients (middle), and NDMM patients (right) analyzed by linear regression model. **P < .01.
