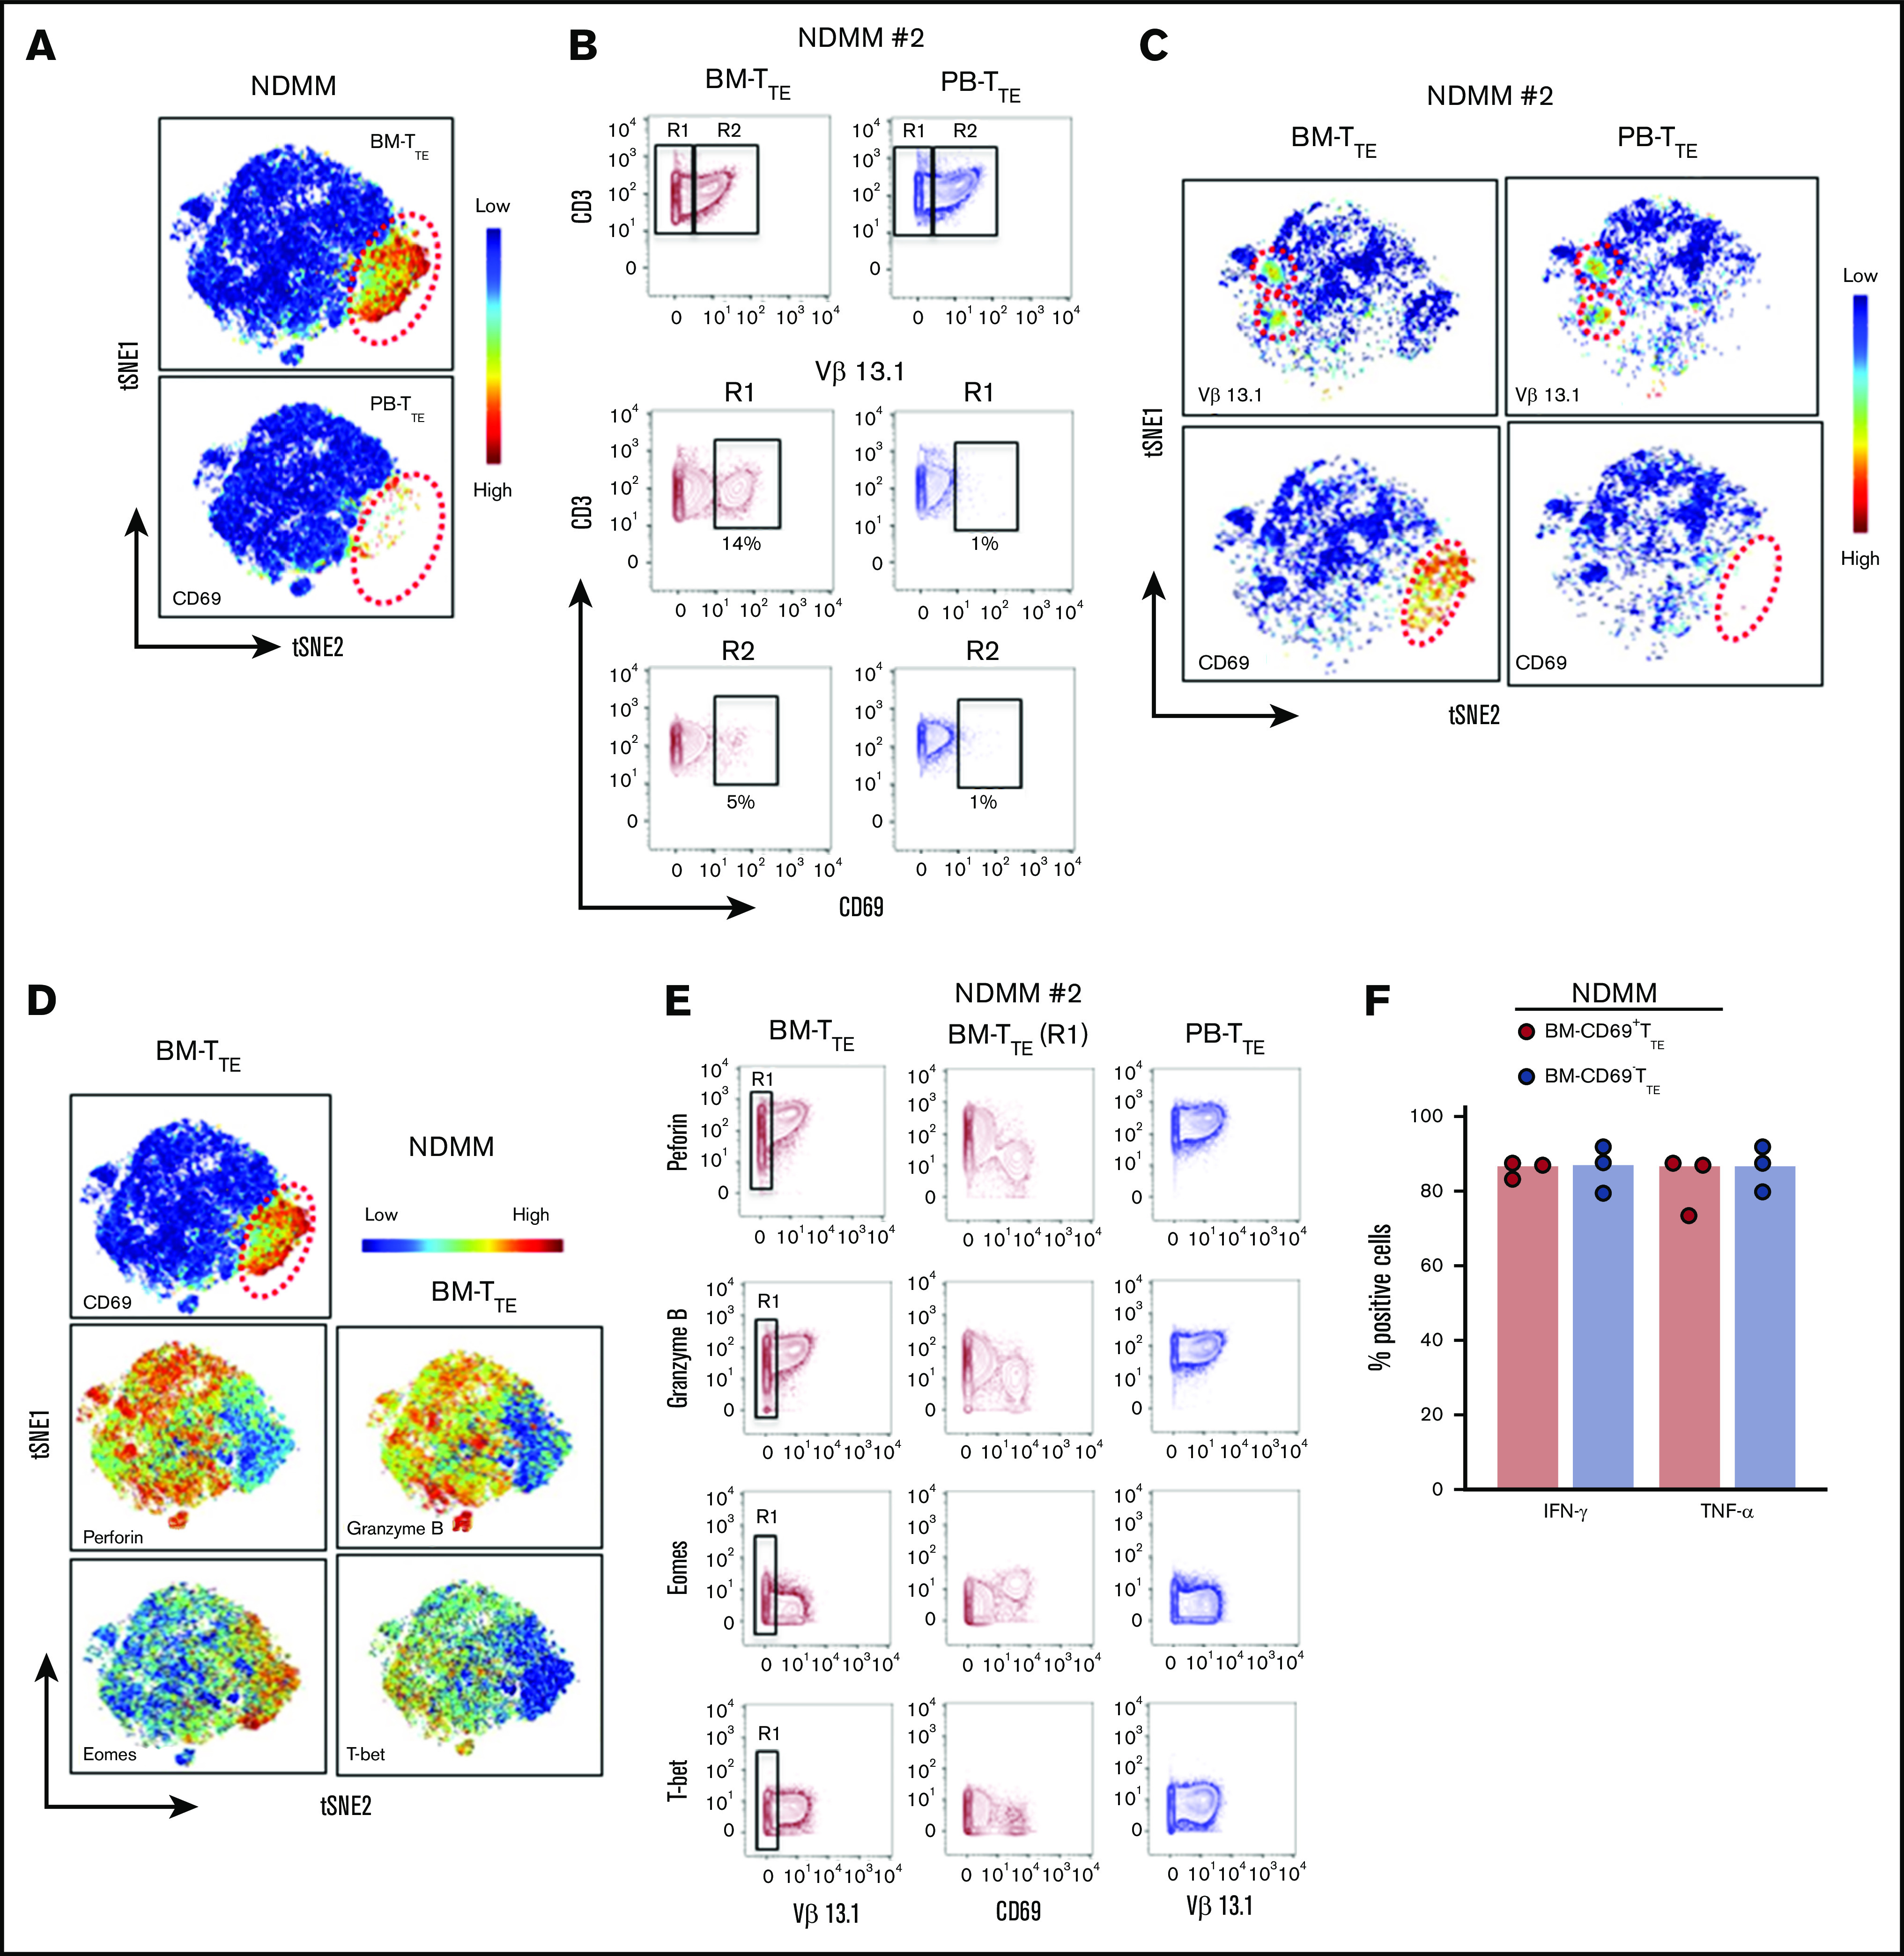
Figure 4.

Detailed phenotype of CD69−TTEand CD69+TTEcells in NDMM patients. (A-E) Mass cytometry data. (F) Fluorescence flow cytometry data. (B-C,E) Data from 1 representative NDMM patient (NDMM #2; Figure 3B,G). (A) tSNE plots show distribution of CD69−TTE and CD69+TTE cells within pooled BM-TTE and PB-TTE cells of NDMM patients (n = 5). The area occupied by CD69+TTE cells is indicated by the red dotted circle. (B) Biaxial contour plots show BM-TTE and PB-TTE cells containing oligoclonal expanded Vβ13.1 family–expressing cells of NDMM patient #2. Regions indicate Vβ13.1−TTE cells (R1) and Vβ13.1+TTE cells (R2, top panel). Biaxial contour plots gated for Vβ13.1−TTE cells (R1, middle panels) and Vβ13.1+TTE cells (R2, bottom panels) show presence of CD69+TTE cells indicated by boxes and numbers. (C) tSNE plots show distribution of Vβ13.1 family–expressing TTE cells (top) and CD69+TTE cells (bottom) within BM-TTE and PB-TTE cells of NDMM #2 indicated by red dotted circles. (D) tSNE plots show distribution of CD69, perforin, granzyme B, Eomes, and T-bet within pooled BM-TTE cells of NDMM patients (n = 5). (E) Biaxial contour plots showing expression of perforin, granzyme B, Eomes, and T-bet in oligoclonal expanded Vβ13.1 family–expressing cells and remaining TTE cells in BM and PB of NDMM patient #2. Gated BM-TTE cells that do not express Vβ13.1 family (R1) are shown in the middle panels. (F) Bars (median with scatter plots) show proportion of BM-CD69+TTE and BM-CD69−TTE cells producing IFN-γ and TNF-α (NDMM, n = 3).
