Figure 1.
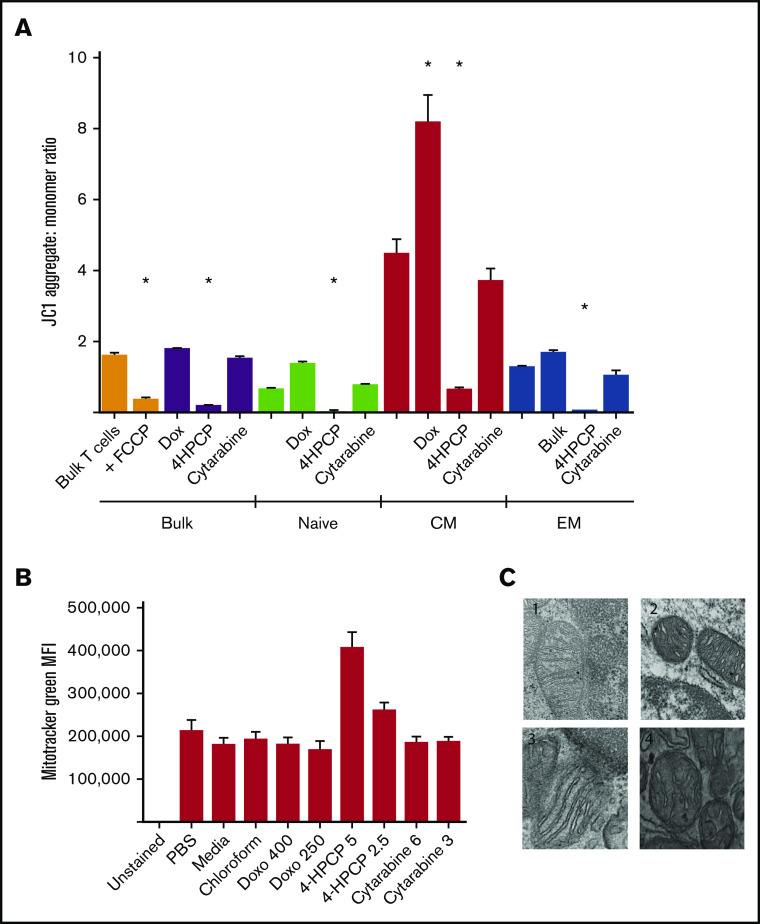
Mitochondrial integrity after chemotherapy exposure. (A) T cells either in bulk or sorted into 3 subsets (naive, CM, or EM) were exposed to chemotherapy for 24 hours, recovered, and then the Δψ measured by JC1 dye. FCCP is used as a positive control to show ablation of mitochondrial potential in untreated T cells; unlabeled columns are no-treatment controls. Cyclophosphamide (4HPCP) ablates the membrane potential in all T-cell subsets. 4HPCP, cyclophosphamide at 2.5 μM; Cytarabine, cytarabine at 3 mM; Dox, doxorubicin at 400 nM. (B) There is no apparent change in mitochondrial biomass after chemotherapy exposure with the exception of more dye uptake in cyclophosphamide-exposed T cells. Doxo, doxorubicin. (C) Transmission electron microscopy (×75 000) of T cells reveals ultrastructural impact of cyclophosphamide. 1, T cells from a normal donor; 2, the same donor T cells exposed to cyclophosphamide for 24 hours; 3, T cells from a non-Hodgkin lymphoma patient prior to any chemotherapy; and 4, the same patient 2 weeks after cyclophosphamide-containing chemotherapy. The short and widened cristae are characteristic of cyclophosphamide exposure in vitro or in vivo. *P < .05. MFI, mean fluorescence intensity.

