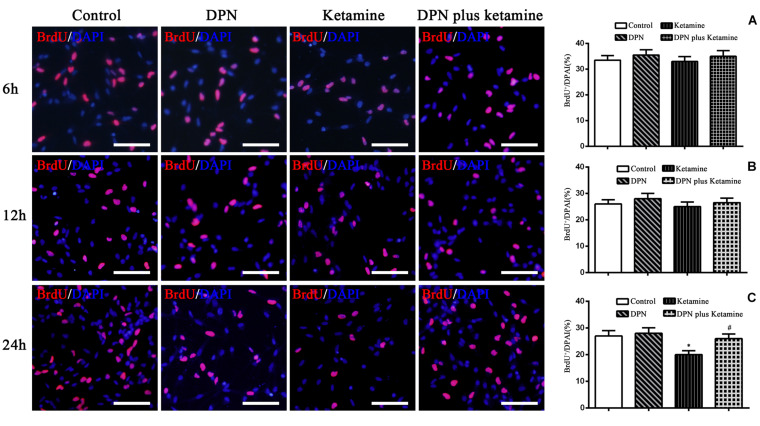
FIGURE 3.
Effect of exposure time on proliferation of NSPCs in different treatment groups. The typical images of BrdU-positive cells (red) in control, DPN, ketamine, and DPN plus ketamine group at 6, 12, and 24 h, respectively. Scale bar = 100 μm. (A–C) Quantification of BrdU-immunoreactive cells after different treatments at 6, 12, and 24 h, respectively. *P < 0.01 compared with the control group, #P < 0.01 compared with ketamine group. Data were collected from three independent experiments and are presented as means ± SEM.

